Little Master, Big Impact
Dave Wilson |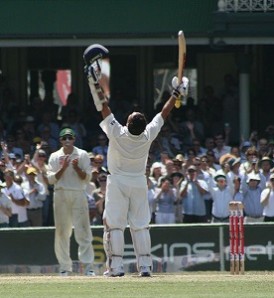
In this article I introduced my initial work on batting impact, limiting the exercise to the fourth innings for two reasons; a) those innings listed were more obviously impactful, being as how most were crafted with a specific target in mind and b) I didn’t necessarily like the results I was seeing as regards earlier innings.
It became apparent, after not an insignificant amount of thought, that there was a flaw in the initial work. The essential bedrock of the system was fine, being based on the difference in win probability from the time the batsman went into bat and after he was out (or his innings otherwise brought to a close). Looking at the status at only those two points however, a batsman might stay in for a significant time and make a significant number of runs, but depart with the win probability at a lower level than when he came in, which clearly wasn’t a fair assessment of his contribution.
The problem was that I was ignoring everything that occurred in between the batsman coming in and going out. This was addressed in this piece, which detailed how a new method of looking at essentially the same data could more reasonably assess the impact which all players had on the game, regardless of discipline.
The basic principle is this – when a batsman comes in, he and his partner will make a number of runs until (usually) one of them is out. Prior to the dismissal, the win probability for his team will usually have increased, depending on the state of the match at the start and end, in terms of runs behind or ahead and wickets left to give. Let’s say the win probability when the new batsman joins his partner is 0.349, and after scoring 100 runs together the win probability has risen to 0.491, an increase of 0.142. On his dismissal, the win probability then reduces to 0.437. Under the old method, that would represent an overall change in win probability of 0.088 (i.e. 0.437 – 0.349). However with the new method, we have an increase in win probability during the partnership of 0.142, and what’s more, we also have the change in win probability due to the dismissal which we can account for, i.e. 0.054 (0.491 – 0.437).
This latter fact means we can now bring the fielding side into the awarding of win probability changes. This negative change in win probability (for the batting team) is split three ways, with a third going to the batsman as a negative impact, while the remaining two-thirds is split between the bowler and fielder (if any were involved), as a positive change (given that the dismissal typically improves their chances of winning). So, if in the example given above both batsman scored 45 runs with 10 going to extras, each would receive a positive win probability change of (0.142 * 45/100) = 0.0639 (switching to percent for readability, that’s 6.39%). The dismissed batsman would also be credited with a negative change of (0.054/3) = 0.018 or 1.80%, so his contribution for that partnership would be 6.39% – 1.80% = 4.59%. This contribution would be added to his other contributions from previous partnerships, if any, to give an overall win probability impact for his innings. The not out batsman has the same 6.39% added to his impact aggregate, but with no deduction as he remains not out at this point.
All impact figures can thus be totalled for batting, fielding and bowling for each player, and these match figures totalled to give career figures. There is another advantage of this method of assessing an innings, which is that it considers only the impact throughout the innings and nothing which occurs after the innings in question, so a more reasonable measure of a performance in a losing cause is also possible. I’m in the process of refining the database to complete the career figures for all Test cricketers, but in the meantime and given his recent retirement, I couldn’t resist looking ahead at all of Sachin Tendulkar’s performances.
Although I intended to use these win probability impact figures to look at careers, in the same way the method can be used to look at series performances, match performances or even individual innings. In the latter case, now that I’ve seen most of the figures generated for every innings in Test history, I can set cut-offs for great innings. By eye, I’ve determined that we can say that a significant innings is represented by an impact aggregate of 20%, a very significant innings is 25%, while an innings which contributes an aggregate impact on the win probabiity of 30% is a great innings.
By these measures, Tendulkar has crafted 13 significant innings, 10 very significant innings and 13 great innings. Here is a list of Tendulkar’s very significant innings, in chronological order.
85 vs West Indies 1994/95, 1st Test in Mumbai, 3rd innings – India won by 96 runs
177 vs England 1996, 3rd Test at Nottingham, 1st innings – match drawn
126 vs New Zealand 1999-00, 1st Test at Mohali, 3rd innings – match drawn
217 vs New Zealand 1999-00, 3rd Test at Ahmedabad, 1st innings – match drawn
117 vs West Indies 2001-02, 2nd Test at Port of Spain, 1st innings – India won by 37 runs
248* vs Bangladesh 2004-05, 1st Test at Dhaka, 2nd innings – India won by an innings and 140 runs
109 vs Sri Lanka 2005-06, 2nd Test at Delhi, 1st innings – India won by 188 runs
153 vs Australia 2007-08, 4th Test at Adelaide, 1st innings – match drawn
109 vs Australia 2008-09, 4th Test at Nagpur, 1st innings – India won by 172 runs
76 vs West Indies 2011-12, 1st Test at Delhi, 4th innings – India won by 5 wickets
We can see that these are spread throughout his career, over a period of some 18 years. Additionally, we can see that an innings doesn’t have to be significant in terms of total runs scored in order to rate as significant in terms of match impact.
Finally, here are Tendulkar’s great innings, ranked in reverse order in terms of aggregate win probability impact (abbreviated to WPI).
WPI 31.02% 179 vs West Indies 1994-95, 2nd Test at Nagpur, 1st innings – match drawn
On a slow pitch, Wisden described Tendulkar’s century as “the most remarkable”. He hooked Walsh for six to bring up his ton, ultimately spending nearly seven hours at the crease, his concentration further tested with two interruptions due to crowd disturbances.
WPI 31.91% 177 vs Australia 1997-98, 3rd Test at Bangalore, 1st innings – Australia won by 8 wickets
Though this was another slow pitch, Tendulkar’s 177 was made out of 281 while he was at the crease and included 29 fours and 3 sixes. Wisden opined he was “impossible to contain”, while Warne movied past Lance Gibbs to become the most successful spin bowler ever in Tests.
WPI 32.30% 155 vs South Africa 2001-02, 1st Test in Bloemfontein, 1st innings – South Africa won by 9 wickets
On a recently laid pitch which was liberally grassed and initially bouncy, man of the match Shaun Pollock’s early successes were halted by Tendulkar’s “awesome mastery” in partnership with Sehwag, who himself produced a flawless debut century. Tendulkar became at 28 the youngest ever to make 7000 runs, beating the previous record holder David Gower, who was 31. Tendulkar’s 100 came off only 114 balls. This match was described in some detail in Martin’s recent feature.
WPI 32.59% 119* vs England 1990, 2nd Test in Manchester, 4th innings – match drawn
The first of Tendulkar’s truly great innings came with what was his maiden Test century. Coming in with four wickets down and still some 300 runs in arrears, when he was joined by Prabhakar India were just 183 for six and with a further two and a half hours left to survive. Though he was dropped on 10, Wisden reckoned “He looked the emobidment of India’s famous opener, Gavaskar”. Deservingly awarded the Man of the Match award.
WPI 32.89% 113 vs New Zealand 1998-99, 2nd Test at Wellington, 3rd innings – New Zealand won by 4 wickets
Trailing by 144 runs on first innings scores, Wisden described this innings as ‘violent’. In a match of frequent changes of fortune (according to win probability, the lead changed hands six times in the 4th innings alone), Tendulkar was “rampant”, reaching his ton off only 123 balls, before being caught top-edging the new ball after lunch.
WPI 33.13% 155*vs Australia 1997-98, 1st Test at Chennai, 3rd innings – India won by 179 runs
Billed as champion bowler vs champion batsman, round one went to Warne, having Tendulkar caught for just four in India’s first innings. In the second innings however, Tendulkar played one of the great innings as he steered India towards setting a stiff target of 348, Australia eventually falling 180 runs short.
WPI 35.00% 139 vs Sri Lanka 1997-98, 2nd Test at Colombo, 2nd innings – match drawn
Captain Tendulkar’s ton was slightly overshadowed by Ganguly’s 147, but was no less impactful. In this, his 13th century, he was given a second chance when dropped on 34, as he and Ganguly put on 150 for the fifth wicket. Deposed captain Mohammad Azharuddhin then saved the match with his 108* in the 4th innings.
WPI 36.49% 176 vs West Indies 2002-03, 3rd Test at Kolkata, 3rd innings – match drawn
West Indies caused a stir when they selected no spinner for Kolkata. Following on from the recent miracle turnaround there, this time around when Ganguly was out and India still 52 behind with four wickets down in their second innings, their win probability was less than 10%. However, a fifth wicket stand of 214 between Tendulkar and Laxman turned the game around. Tendulkar, who was voted Man of the Match, stayed seven hours at the crease to save the match.
WPI 37.14% 146 vs South Africa 2010-11, 3rd Test at Cape Town, 2nd innings – match drawn
Tendulkar’s 51st Ton was the winner of cricinfo’s Test Batting award for the year. Kallis’ efforts in this match were described by cricinfo as superhuman, but in the second innings Tendulkar and Dale Steyn produced “a battle for the ages.” Indeed, Tendulkar was caught off Steyn’s second ball when on 49, however Steyn for some reason didn’t appeal along with Boucher.
WPI 43.89% 103* vs England 2008-09, 1st Test at Chennai, 4th innings – India won by 6 wickets
“This is something I wanted to do. I’ve scored a hundred in the second innings [before], but to actually win a match, play the winning shot, that was something I wanted to do. This makes it really special.” Finally, in his 250th Test innings, Tendulkar added a successful fourth innings run chase to his list of achievements. He dedicated his hundred to those affected by the recent Mumbai terrorist attacks. The fifth wicket partnership with Yuvraj realised 163 as they chased down 386, built on the back of Sehwag’s dazzling 83. The target was the fourth highest ever to be overcome in Tests, and the highest ever successfuly chased in India. Sachin’s 41st century was his third made in the 4th innings and the first such innings in an Indian victory, though if that total seems low it should be noted that at the time only Gavaskar and Ponting had more, with four each.
WPI 47.51% 214* vs Australia 2010-11, 2nd Test at Bangalore, 2nd innings – India won by 7 wickets
An innings which moved him to top spot in the ICC rankings, the ninth time he had ranked at the pinncale but the first time since 2002. Scoring the most runs in 2010, a total of 1270 which included four tons and two doubles, this was his 49th Test century. A 308-run partnership with Murali Vijay was adorned by him reaching his century with a six, the fifth time he had achieved that feat.
WPI 48.57% 136 vs Pakistan 1998-99, 1st Test at Chennai, 2nd innings – Pakistan won by 12 runs
This match was played under huge security, with 3000 police guarding the stadium at Chennai. Tehndulkar was suffering from a back strain, yet he batted for 405 minutes, departing with India needing just 17 runs. Amazingly, the next three wickets added only four runs and India lost a game they should have won. Too bad he couldn’t see this one through to the end, but when he was out India were virtual certainties to win.
WPI 64.38% 154* vs Australia 2007-08, 2nd Test at Sydney, 2nd innings – Australia won by 122 runs
“A masterclass, virtually without flaw…he gave no chances in 429 minutes at the crease…Ponting stationed permanent boundary sweepers square on both sides of the wicket in an attempt to restrict him.” So ran the copy in Wisden’s report of this game, as Tendulkar fashioned his most impactful innings after having already played 229 Test innings before this one. Not only was this innings his most impactful, it was by a significant amount over the next best and once I’m done I think this will stand as one of the most impactful innings of all time. When Harbhajan came in with seven wickets down, Tendulkar had just 69, and his guiding hand allowed the last three wickets to add 187, proving particularly inspirational to Harbhajan who scored 63. Bad umpiring was to allow Australia back into the match, with Hussey making the most of being given two chances. Then Dravid was given out under controversial circumstances, after which Clarke took three wickets in a single over to seal India’s fate.
The amazing thing looking at the above list is that four of his five most impactful inings were made after having already been a Test cricketer for 20 years. Note that this isn’t a subjective ranking of his best innings, as it only takes into account a purely objective assessment of the impact on win probability over the duration of each innings. I was somewhat surprised by the innings which ranked first, but this may be unfairly overlooked as it came in an Indian loss. The method used here enables innings to be more reasonably assessed in terms of real impact at the time.
It’s not possible until I’m done to see where Tendulkar stands in the pantheon of all-time greats in terms of career impact, however I did look at a couple of other players for reference, namely Brian Lara and Jacques Kallis. Their career numbers are summarised below (all figures based on share of change in percentage of win probability):-
| Player | Career | Per Inns | Per Ton |
| Tendulkar | 2100.5 | 6.42 | 23.05 |
| Lara | 1397.5 | 6.02 | 28.72 |
| Kallis | 1556.9 | 5.62 | 20.30 |
The above shows more or less what I would have expected, that Tendulkar has had more impact on a consistent basis, but that Lara’s important innings had more individual impact than the others. As regards Kallis, he also has a lot of wickets to take into account and so may end up with more overall impact per match.
I’m looking forward to seeing how this all plays out.
Some thoughts on Tendulkar’s retirement
While many of us have been wishing he would just retire, saddened to watch a once-great batsman who had lost much of his magic, it will be odd to have no Tendulkar in Test cricket. Many of CricketWeb’s readers will never have known a time when Tendulkar was not a top-ranked batsman. To put the longevity of his career into perspective consider this; when Tendulkar made his Test debut, the top five ranked batsmen were Javed Miandad, Richie Richardson, Viv Richards, Allan Border and Martin Crowe. When he himself first hit number one, knocking Lara off the top spot five years almost to the day after his debut, David Boon was at three, followed by Salim Malik and Alec Stewart.
Now that he has retired, Tendulkar hopes to be more involved with his project to provide electricity to the more remote areas of his home country – in his own words, he wants to “light up India”.
You already did that, son.


Thanks for this piece. Interesting read.
Comment by ankitj | 12:00am GMT 5 December 2013
Good stuff. I just don’t get interested in exercises such as that, but you seem to have a decent model going.
Comment by harsh.ag | 12:00am GMT 5 December 2013
Cheers guys.
Comment by chasingthedon | 12:00am GMT 6 December 2013
[QUOTE=chasingthedon;3179119]Cheers guys.[/QUOTE]
Some excellent work there. I think theoretically this is the best way to tease out an individual’s contribution to the game. Just out of curiosity, how is the probability value of a team winning calculated?
Comment by indiaholic | 12:00am GMT 6 December 2013
Cheers mate.
The win probability is calculated by first determining the match situation, then searching the database to find all matches in Test history where a similar match situation existed and looking at the various outcomes. We might find that in 75 similar match situation, the batting side won on 10 occasions, that would represent a win probability of 10/75 = 13.3%.
Comment by chasingthedon | 12:00am GMT 6 December 2013