High Impact – Assessing the Great Batting Performances
Dave Wilson |
Over the last few months I’ve been putting together a database of all of the 2,000 or so Test match results, the intention being to be able to predict at any point in a match the likelihood of a particular team winning. The impetus for this was to be able to measure individual performances in terms of their impact on the match result. In this way we can assess the impact of any performance, with bat or ball, and actually at any point in the game.
The Method
The principle is quite simple – e.g. for batting, assess the team’s chances of winning when a particular player comes in to bat, re-assess the chances when he’s out (or when the game is won), then find the increase in win probability, and finally determine the batsman’s share of the increase. Perhaps an example might help; when Mark Butcher came in to bat in the fourth Test at Headingley in the 2001 Ashes series, England were down one wicket with 307 runs required to win, giving them just under a 6% chance of winning – that figure is based on 55 previous Test results where a similar position existed. When Butcher stroked the winning runs it represented an increase in win probability of 94.44%, i.e. a “match won” position of 100.00% less 5.56% win probability when he came into bat, of which Butcher’s share was about 56% (173 out of 307 is 56.35%), so his share of the increase is 94.44% x 56.35%, or 53.22%. So Butcher was responsible for 53.22% of the 94.44% increase in win probability. As I said, simple really.
If we had the time, all innings could be assessed in this way and eventually a career “impact index” could be derived for each player, so that we could ultimately identify the all-time highest impact player, however for now I’m going to restrict this only to fourth innings performances in matches which proved victorious. I’m doing this for a number of reasons, partly because as I intimated it takes a long time, but also because the biggest swings tend to occur in the final innings as there is no further cricket to be played at its conclusion. So there will be no assessment of Beefy’s Headingley heroics, I’m afraid, at least not as part of this feature.
Strength of Opposition
There’s one further wrinkle I’d like to add – it seems reasonable to me that the strength of the opposing attack needs to be taken into account, so I’ve used the archived ICC ratings I derived in an earlier feature. If we don’t do this, then performances such as Inzamam’s against Bangladesh, great though it was, get overrated.
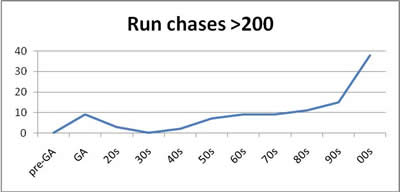
Success of Run Chases over Time
Before we get to the impact innings, however, I’d first like to highlight the varying degree of success in fourth-innings run chases which we’ve seen over time. Looking at successful chases in excess of 200 runs since the first Test, we get the following curve:-
%WinProb is the player?s share of the increase in win probability.
Statistically, regarding the greater number of Tests matches played recently we would expect to see a higher representation from the 21st century, and that is indeed the case here with nine of the twenty listed coming from the year 2000-onwards. Three players have two performances featured here – VVS Laxman, Graeme Smith and Greg Chappell. The earliest represented is Joe Darling’s 160 against England in 1897-98, and there are two other Golden Age knocks featured, Dave Nourse?s match-winning 93* for South Africa against England, and George Hirst’s 58* during what is usually considered to be Jessop’s match at The Oval in 1902, and here is an aspect of this method of rating performances which might surprise some.
When Jessop came in to bat, England statistically had about a 4% chance of winning (ignoring this actual match from our determination of win probability). Jessop proceeded to blast 104 out of 139, an incredible performance to be sure. However, when Jessop was out England still needed 75 runs with only three wickets remaining and the match was at that point about 50-50 as regards win probability (Jessop’s share was thus around 35% of the 46% increase). Meanwhile, the likelihood of England winning when Hirst joined Jessop with four wickets remaining and 105 runs still to get was about 16%, and of course they went on to win, a change in win probability of about 84%, of which Hirst’s share was about 46%. By this measure, Jessop took England from almost certain defeat to a ghost of a chance, while Hirst helped bring the ghost to life – Wisden acknowledged this much in its report, stating that “Hirst’s innings was in its way almost as remarkable as Jessop’s”.
Finally, here are the top five high impact fourth-innings performances.
5. Shane Thomson (NZ), 120* vs Pakistan, Christchurch 1993-94 – win probability share: 57.40%
New Zealand achieved their highest successful run chase ever thanks to both Bryan Young and, to a greater degree, Shane Thomson. When Thomson joined Young New Zealand were 133 for four and their win probability stood at less than 10%. Thomson hit 120 out of 192 to guide his side home and take a Win Probability share of 57.40%.
4. Mark Butcher (Eng), 173* vs Australia, Headingley 2001 – win probability share: 58.42%
When England, chasing 315 against a supremely strong Australian side, lost Atherton with only eight runs on the board, the writing looked to be on the wall for a series whitewash. In strode Mark Butcher, destined to play one of the most legendary innings ever. His 173* came at a strike rate of over 76 and he dominated partnerships of 181 and 75 with Hussain and Ramprakash respectively, etching his name into the annals of great Ashes moments.
3. Adam Gilchrist (Aus), 149* vs Pakistan, Hobart 1999-00 – win probability share: 58.92%
Amazing to think that this was only Gilchrist’s second Test! Chasing 369, Gilchrist came to the crease with Australia still requiring 243 with only five wickets remaining. Statistically they actually had zero chance – never before had such a situation resulted in victory. Gilchrist’s 149* was hit from only 163 balls, though this stupendous knock was not recognized with the Man of the Match award, which went to Justin Langer.
2. Gordon Greenidge (WI), 214* vs England, Lord’s 1984 – win probability share: 59.20%
Greenidge’s 214* remains the highest individual score in a successful run chase, though when West Indies opened the fourth innings they had barely a 3% chance of winning. With sterling support from Gomes in an unbroken stand of 287, Greenidge guided his team to what was then the fifth highest successful run chase ever (342).
1. Brian Lara (WI), 153* vs Australia, Bridgetown 1998-99 – win probability share: 65.69%%
Whenever cricket chat turns to the finest innings ever, this performance comes out top time and again. Only three other batsmen managed over 30 in this innings, with Lara batting for almost six hours to turn this match on its head, a true captain’s performance. The transcendence of this innings is shown in the margin his performance has over everyone else featured in this list, his share of 65.69 being more than 10% better than Greenidge’s share in second place, that being the last time West Indies had scored 300 to win.
I’d like in the future to extend this analysis to encompass all innings i.e. not just those in fourth-innings victories, which will allow us to assess e.g. match-saving innings like Bailey/Watson and Atherton, and also apply the same method to rate match-winning bowling performances. Should be interesting, to say the least.


Great stuff, thanks. A notable player not in there is Tendulkar. What is the highest one of his knocks came?
Also, I wonder if there is a way of doing this for bowlers – their contribution with regards to the difficulty of their team winning.
Comment by Ikki | 12:00am BST 29 March 2011
No Sachin again- its the Wisden top 100 all over again!!!!!
Comment by robelinda | 12:00am BST 29 March 2011
Good analysis. Interestingly Yuvraj makes the list for his 85* even though Sehwag (87) and Tendulkar (103*) don’t make the cut. Hmmm….
Comment by J_C | 12:00am BST 29 March 2011
wow……great work…….didn’t see it in detail in terms of methodology but a pleasant surprise to see Shakib Al Hasan up there in the top 10
Comment by smalishah84 | 12:00am BST 29 March 2011