Zero to Sixty – the second hundred, May to Gavaskar
Dave Wilson |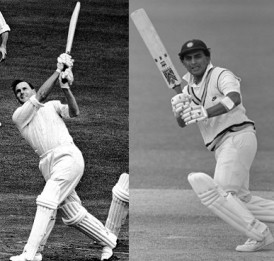
This feature expands on my previous articles, Zero to Sixty – Important Runs in Test Cricket and Zero to Sixty – the First Hundred from Grace to Worrell. These articles summarise the performances of top batsmen throughout Test history when their team’s win expectation was 60% or less when he came into bat. Below are the details of the second hundred batsmen under review.
The tables below are basically split chronologically into groups of five batsmen, showing the Player name, peak ICC rating, Average of important innings, total number of important hundreds and fifties, Average of regular innings, total number of regular hundreds and fifties, the differential between important and regular averages and the difference between the number of important runs scored as a percentage of all runs and the number of important innings as a percentage of all innings. An asterisk shows a new high in the particular category of important hundreds.
| Player | ICCrate | iAvg | i100/i50 | rAvg | 100/50 | AvDiff | %iDiff |
| AJ Watkins | 506 | 57.00 | 1/4 | 24.00 | 1/0 | +33.00 | +12.1% |
| DS Atkinson | 469 | 36.29 | 1/4 | 20.00 | 0/1 | +16.29 | +11.2% |
| AF Rae | 565 | 46.00 | 4/2 | 46.80 | 0/2 | -0.80 | -2.2% |
| PR Umrigar | 781 | 36.65 | 6/12 | 75.17 | 6/2 | -38.52 | -8.3% |
| RT Simpson | 674 | 36.70 | 1/4 | 30.32 | 3/2 | +6.38 | +3.5% |
Though an all-rounder, ‘Allan’ Watkins shows a very high average differential albeit in a small number of Tests, though according to CW’s Martin Chandler it was West Indian Denis Atkinson who gave the best ever all-round performance. Polly Umrigar holds the highest ICC ranking of this group, but also has the most negative differential as his regular average is almost 40 runs higher than his important average.
| Player | ICCrate | iAvg | i100/i50 | rAvg | 100/50 | AvDiff | %iDiff |
| TE Bailey | 607 | 33.83 | 1/9 | 21.24 | 0/1 | +12.59 | +7.6% |
| DB Close | 469 | 29.86 | 0/4 | 17.69 | 0/0 | +12.17 | +9.2% |
| JR Reid | 745 | 32.31 | 4/21 | 43.44 | 2/1 | -11.14 | -3.1% |
| DS Sheppard | 538 | 33.64 | 1/4 | 48.00 | 2/2 | -14.36 | -6.6% |
| JW Burke | 725 | 39.46 | 2/5 | 25.62 | 1/0 | +13.84 | +12.6% |
More all-rounders in this group, probably the most well-known of which is Trevor Bailey, who has a pretty high average differential, as do Brian Close and Jim Burke. Big hitting New Zealander John Reid fashioned a high number of important fifties with 25. The Reverend David Sheppard found a higher calling than cricket, though some may disagree with that sentiment.
| Player | ICCrate | iAvg | i100/i50 | rAvg | 100/50 | AvDiff | %iDiff |
| DJ McGlew | 797 | 45.55 | 5/9 | 32.94 | 2/1 | +12.61 | +5.0 |
| JHB Waite | 613 | 26.98 | 1/12 | 40.00 | 3/4 | -13.02 | -9.3% |
| TW Graveney | 672 | 44.76 | 5/15 | 43.77 | 6/5 | +0.99 | +1.3% |
| PBH May | 941 | 56.52 | 10/16 | 33.13 | 3/6 | +23.39 | +10.5% |
| WR Endean | 700 | 35.65 | 2/7 | 29.60 | 1/1 | +6.05 | +5.2% |
Three South Africans and two Englishmen in this group, though Peter May is the class of the bunch, boasting an ICC Test player rating only ever exceeded by five batsmen. Tom Graveney’s ICC rating is surprisingly low, being less than Russell Endean’s rating, for example; Graveney’s obituary in the Daily Telegraph contended that Long Tom ‘fell short in moments of crisis’, however by this measure Graveney shows as having been remarkably consistent, though his conversion rate is far better in regular innings. In my piece in which I compared him directly with Hanif, it seemed he trailed the Pakistani when considering performances when the match looked lost, but when also taking into account the matches which were in the balance Graveney looks better; it could be that he lost interest in the case of the former. Peter May was a remarkable batsman and this study reveals a very high average differential as well as a healthy conversion rate in important innings.
| Player | ICCrate | iAvg | i100/i50 | rAvg | 100/50 | AvDiff | %iDiff |
| P Roy | 640 | 33.63 | 5/9 | 22.14 | 0/0 | +11.49 | +3.8% |
| VL Manjrekar | 691 | 35.90 | 4/14 | 53.53 | 3/1 | -17.64 | -4.3% |
| R Benaud | 623 | 24.57 | 2/4 | 24.32 | 1/5 | +0.25 | -1.0% |
| CC McDonald | 891 | 43.65 | 4/10 | 33.30 | 1/7 | +10.35 | +6.8% |
| Hanif Mmd | 819 | 44.22 | 9/13 | 42.87 | 3/2 | +1.35 | +1.1% |
The Coopers & Lybrand cricket rankings were used as the basis for Simon Wilde’s book Number One; those rankings have Colin McDonald as the world’s leading batsman of 1959 and certainly his numbers here are good, with a double-digit average differential. I mentioned Hanif earlier and it can certainly be seen that his numbers here are comparable to Graveney’s.
| Player | ICCrate | iAvg | i100/i50 | rAvg | 100/50 | AvDiff | %iDiff |
| Imtiaz Ahmed | 563 | 33.21 | 3/10 | 11.77 | 0/1 | +21.44 | +10.7% |
| Waqar Hasan | 581 | 34.40 | 1/5 | 20.14 | 0/1 | +14.26 | +7.1% |
| AK Davidson | 526 | 25.82 | 0/5 | 22.50 | 0/0 | +3.32 | +4.8% |
| JKC Holt | 575 | 32.71 | 1/4 | 56.20 | 1/1 | -23.49 | -7.0% |
| GS Sobers | 938 | 59.51 | 20*/17 | 55.41 | 6/13 | +4.10 | +2.3% |
Imtiaz Ahmed certainly seems to have been a batsman who needed something to aim at, as was countryman Waqar Hasan. Allan Davidson was more of a bowling all-rounder, but he’s one of my favourites so I included him. Although Garry Sobers’ 20 important hundreds is not a record, he is the only batsman other than Bradman to reach 20 so far, and also maintained both averages over 55.
| Player | ICCrate | iAvg | i100/i50 | rAvg | 100/50 | AvDiff | %iDiff |
| MC Cowdrey | 874 | 44.49 | 16/24 | 43.98 | 6/14 | +0.51 | +0.9% |
| PJP Burge | 697 | 38.74 | 3/8 | 37.10 | 1/4 | +1.65 | -0.2 |
| KF Barrington | 914 | 61.14 | 15/24 | 52.97 | 5/11 | +8.16 | +4.9% |
| TL Goddard | 659 | 35.98 | 1/13 | 31.38 | 0/5 | +4.60 | +0.9% |
| FJ Titmus | 401 | 22.00 | 0/8 | 23.19 | 0/2 | -1.19 | +0.7% |
Two all-time great England batsmen in this group. I had the honour of writing about Colin Cowdrey’s first great batting performance in Masterly Batting, and his numbers here are pretty consistent, though Ken Barrington shades him, achieving the rare feat of averaging over 60 in important innings. Cowdrey’s total of 40 important fifties equalled Hutton’s best, while Barrington was just one behind. I always had a soft spot for Peter Burge; one of the first cricket books I ever read was my dad’s tour diary on the 1961 Ashes (not that my dad wrote it – I believe that honour goes to Charles Fortune), during which Burge hit his highest Test score of 181 in the final Test to ensure Australia would retain the Ashes.
| Player | ICCrate | iAvg | i100/i50 | rAvg | 100/50 | AvDiff | %iDiff |
| NJ Contractor | 722 | 33.73 | 1/11 | 15.50 | 0/0 | +18.23 | +5.7% |
| RG Nadkarni | 533 | 27.50 | 1/6 | 16.56 | 0/1 | +10.94 | -5.9% |
| PE Richardson | 802 | 37.95 | 4/6 | 36.41 | 1/3 | +1.54 | +0.4% |
| KD Mackay | 683 | 35.15 | 0/8 | 31.00 | 0/5 | +4.15 | +1.5% |
| RB Kanhai | 875 | 50.69 | 12/23 | 37.84 | 3/5 | +12.85 | +3.9% |
Nari Contractor led India to a historic series win over England in 1961-62 and clearly set an example with the bat, while countryman Bapu Nadkarni, though best known as a spin bowler, was good enough to fashion a first-class average of over 40 with the bat. While following the Ashes tour of 1962-63, writer Alan Ross visited Arthur Mailey; when asked why he hadn’t attended the Test at Brisbane, Mailey replied “I could never watch a Test in a state of which Ken Mackay was a resident” and as Ross left, Mailey called out to him ‘See you at Adelaide – Melbourne too, after Mackay’s out!” – enough said. Rohan Kanhai is another personal favourite and I’m delighted to see this study confirm my high opinion of him.
| Player | ICCrate | iAvg | i100/i50 | rAvg | 100/50 | AvDiff | %iDiff |
| FCM Alexander | 574 | 22.22 | 0/3 | 40.07 | 1/4 | -17.85 | -13.7 % |
| RB Simpson | 853 | 45.81 | 6/20 | 49.85 | 4/7 | -4.04 | -0.5% |
| CC Hunte | 823 | 47.91 | 8/10 | 33.29 | 0/3 | +14.63 | +3.5% |
| Saeed Ahmed | 784 | 37.78 | 2/13 | 53.08 | 3/3 | -15.30 | -5.2% |
| MJK Smith | 611 | 33.17 | 2/8 | 30.08 | 1/3 | +3.09 | -0.5% |
Bob Simpson has typically fared well in my impact studies, but he was a true all-rounder with 110 catches and 71 wickets to his name. Conrad Hunte is another batsman I particularly enjoyed and as with Kanhai he fares well here with a high average differential and a very good conversion rate. Saeed Ahmed had quite a few important fifties to his name but only converted two.
| Player | ICCrate | iAvg | i100/i50 | rAvg | 100/50 | AvDiff | %iDiff |
| ER Dexter | 870 | 47.59 | 6/19 | 48.07 | 3/8 | -0.48 | +1.2% |
| R Subba Row | 710 | 60.67 | 3/3 | 28.44 | 0/1 | +32.22 | +19.5% |
| CJ Borde | 703 | 35.04 | 3/15 | 43.43 | 2/3 | -8.39 | -2.2 |
| BF Butcher | 753 | 44.08 | 4/13 | 40.91 | 3/3 | +3.17 | +1.8% |
| NCL O’Neill | 799 | 48.89 | 4/9 | 41.22 | 2/6 | +7.67 | +4.2% |
Ted Dexter would practice his golf swing while fielding when he was captain of England, so it comes as no surprise that he batted just as well regardless of the situation – his average differential is very flat. England opener Raman Subba Row topped 60 in important innings, with an extremely high average differential and the second highest iDiff so far. Norm O’Neill was dumped by Australia at just 28 but it seems he answered the call during the relatively short time he was in favour with the selectors.
| Player | ICCrate | iAvg | i100/i50 | rAvg | 100/50 | AvDiff | %iDiff |
| JS Solomon | 570 | 27.18 | 0/3 | 42.82 | 1/6 | -15.64 | -13.6% |
| Mushtaq Mmd | 767 | 37.35 | 8/12 | 45.43 | 2/6 | -8.08 | -1.2% |
| G Pullar | 718 | 46.40 | 4/8 | 35.00 | 0/4 | +11.40 | +6.8% |
| SM Nurse | 741 | 52.25 | 5/9 | 33.31 | 1/1 | +18.94 | +8.7% |
| RW Barber | 587 | 39.31 | 1/8 | 23.70 | 0/1 | +15.61 | +8.5% |
Joe Solomon does not score well, but in any case his place in history was secured with his amazing fielding during the first tied Test. Mushtaq has a good conversion rate, though his average differential is negative. Seymour Nurse averaged over 50 in important innings, while Bob Barber, who made a famous 185 at Sydney in 1965-66, later switched from flogging bowlers to successfully flogging toilet cleaners.
| Player | ICCrate | iAvg | i100/i50 | rAvg | 100/50 | AvDiff | %iDiff |
| J Burki | 515 | 29.36 | 2/3 | 35.50 | 1/1 | -6.14 | -4.5 |
| WM Lawry | 878 | 44.73 | 9/20 | 55.08 | 4/7 | -10.35 | -3.0% |
| BC Booth | 712 | 42.21 | 5/6 | 42.22 | 0/4 | -0.01 | -2.7% |
| FM Engineer | 619 | 33.16 | 2/16 | 21.53 | 0/0 | +11.63 | +8.1% |
| DN Sardesai | 603 | 39.33 | 4/7 | 42.09 | 1/2 | -2.76 | +2.3% |
Bill Lawry has a reputation as being the stoniest of stonewallers, but he scored a lot of important fifties. Brian Booth played in 29 Tests but apparently merits no profile on cricinfo; not to worry, here he shows up as the Test batsman least impacted by the situation with an average differential of -0.01, and a very good conversion rate in important innings to boot. Farokh Engineer also knocked up a good few important fifties, as well as becoming what I believe was Lancashire’s first Brylcreem Boy.
| Player | ICCrate | iAvg | i100/i50 | rAvg | 100/50 | AvDiff | %iDiff |
| EJ Barlow | 734 | 47.79 | 5/11 | 41.18 | 1/4 | +6.61 | +2.0% |
| KC Bland | 733 | 50.19 | 2/5 | 47.31 | 1/4 | +2.88 | +1.7% |
| MAK Pataudi | 667 | 37.87 | 5/15 | 23.94 | 1/1 | +13.93 | +8.0% |
| PH Parfitt | 632 | 38.59 | 2/5 | 44.88 | 5/1 | -6.30 | -0.1% |
| JH Edrich | 790 | 44.05 | 7/18 | 42.66 | 5/6 | +1.39 | +0.7% |
Two popular South African cricketers here in Barlow and Bland, both of whom typically scored well in my previous impact studies, ‘Bunter’ as an all-rounder and Bland primarily because of his fielding prowess, however as we can see Bland was a more than useful batsman in all situations. India’s first great captain Mansur Ali Khan, the Nawab of Pataudi, clearly led by example. In my right-handed youth, I actually tried batting left-handed for a while to emulate John Edrich, however it soon became clear that all we have in common is hairy forearms.
| Player | ICCrate | iAvg | i100/i50 | rAvg | 100/50 | AvDiff | %iDiff |
| PJ Sharpe | 581 | 56.17 | 1/4 | 22.40 | 0/0 | +33.77 | +9.6% |
| RG Pollock | 927 | 62.52 | 5/5 | 58.43 | 2/6 | +4.09 | +5.2% |
| IR Redpath | 756 | 38.96 | 4/20 | 53.24 | 4/11 | -14.28 | -6.7% |
| G Boycott | 764 | 50.89 | 18/38 | 36.35 | 4/4 | +14.54 | +4.6% |
| RM Cowper | 818 | 47.21 | 2/7 | 46.19 | 3/3 | +1.03 | -1.1% |
Phil Sharpe was a remarkable slip-fielder and though his average differential is very high, he only played in a handful of Tests. South African legend Graeme Pollock averaged over 62 in important innings and over 58 in both categories, being the first to do so since Bradman. Australian Ian Redpath scored a lot of important fifties, but Geoff Boycott fashioned 56 such innings, a significant improvement on the previous record of 40 jointly held by Hutton and Cowdrey. His 18 important centuries was third only to Bradman and Sobers at this time, and his average differential is highly positive. Sir Geoffrey’s ICC rating seems surprisingly low; certainly I would rate him ahead of, say, Peter Richardson (802).
| Player | ICCrate | iAvg | i100/i50 | rAvg | 100/50 | AvDiff | %iDiff |
| Asif Iqbal | 718 | 43.19 | 9/10 | 30.04 | 2/2 | +13.15 | +5.9% |
| Majid Khan | 791 | 38.84 | 6/15 | 41.76 | 2/4 | -2.92 | -0.4% |
| IM Chappell | 811 | 43.81 | 10/15 | 40.57 | 4/11 | +3.23 | +0.9% |
| BE Congdon | 680 | 31.78 | 6/13 | 34.35 | 1/6 | -2.57 | -1.0% |
| KD Walters | 922 | 46.86 | 10/19 | 51.05 | 5/14 | -4.19 | -2.3% |
It’s easy to forget that Asif Iqbal was once an entertaining batsman, and here he shows up with an excellent conversion rate in important innings. Imran Khan’s cousin Majid scored a lot of important fifties, as did everyone in this group actually. Walters is clearly the class of these five from an ICC ratings perspective but does not greatly shade his countryman Ian Chappell in this study. Walters established his reputation early on so I broke down their Test innings in 25-innings blocks to do a closer comparison, looking at i100s, i50s and iFailures (a failure when the win probability was less than 60% – Martin Chandler suggested that a failure should be anything below 24, since that was his highest ever score, which he achieved on two occasions, no less). In their first 75 Tests, Walters had 6 tons, 11 fifties (17 x i50+) and 25 failures, while Chappelli hit 4 tons, 8 fifties (12 x i50+) and had 28 failures. In his last 50 Tests, Walters had 3 tons, 6 fifties (9 x i50+) and 20 failures, while Chappelli finished with 8 tons, 11 fifties (19 x 50+) and 17 failures. I think Walters’ reputation benefitted from a fast start and a certain amount of hero worship over his lifestyle, but it should be noted that, although there’s not much in it, Walters played more important innings than Chappelli (percentage-wise that is, 66% to 58% – Walters had 80 important innings to Chapelli’s 79). I was privileged to see the two of them bat in my very first Test match at Headingley in 1968, along with Bob Cowper and also witnessed first-hand a fine 92 from Ian Redpath.
| Player | ICCrate | iAvg | i100/i50 | rAvg | 100/50 | AvDiff | %iDiff |
| KR Stackpole | 782 | 39.95 | 6/10 | 31.16 | 1/4 | +8.79 | +4.1% |
| C Milburn | 510 | 58.20 | 2/2 | 18.00 | 0/0 | +40.20 | +14.0% |
| BL D’Oliveira | 682 | 40.18 | 2/10 | 39.88 | 3/5 | +0.31 | -2.8% |
| DL Amiss | 826 | 49.06 | 10/10 | 35.61 | 1/1 | +13.44 | +4.7% |
| CH Lloyd | 818 | 48.54 | 14/26 | 43.09 | 5/13 | +5.45 | +1.5% |
Colin Milburn is a hero of mine, as evidenced here, and his extremely high average differential is skewed by the fact that he was selected for only a handful of Tests – frustratingly for me, he had played in the Lord’s Test but was dropped for the Headingley Test mentioned above. Basil D’Oliveira’s averages are very flat, presumably his life up to that point had put the game of cricket into some perspective. Finally in this group are two favourites of our own Martin Chandler; few can claim to having co-written a piece with Mr Amiss himself, but Martin can, as the pair were responsible for the Masterly Batting essay on Amiss’ 262* against West Indies at Kingston in 1974. I’m personally not surprised to see Amiss score so well in this study and his conversion rate in important innings is excellent. Lancashire favourite Clive Lloyd scored 40 important fifties, joint second with Hutton and Cowdrey behind Boycott.
| Player | ICCrate | iAvg | i100/i50 | rAvg | 100/50 | AvDiff | %iDiff |
| APE Knott | 650 | 34.79 | 5/24 | 27.10 | 0/6 | +7.70 | +3.9% |
| AP Sheahan | 601 | 33.19 | 2/2 | 34.90 | 0/5 | -1.71 | -4.2% |
| KR Fletcher | 761 | 41.72 | 5/14 | 36.39 | 2/5 | +5.33 | +1.2% |
| CA Davis | 747 | 63.94 | 3/3 | 38.75 | 1/1 | +23.19 | +3.8% |
| RC Fredericks | 753 | 43.34 | 6/19 | 39.88 | 2/7 | +3.46 | +2.7% |
Alan Knott is often lauded as the best wicket-keeper who ever kept in a Test, and was known for adjusting his batting game to suit the situation – this is supported by his important innings numbers. Charlie Davis is part of an elite group who managed an iAverage of more than 60 – he should have played more than 15 Tests. Roy Fredericks was responsible for one of the most famous innings of all time, his 169 out of 258 against Lillee and Thomson at the WACA in 1975 and his numbers in important innings are also good.
| Player | ICCrate | iAvg | i100/i50 | rAvg | 100/50 | AvDiff | %iDiff |
| BF Hastings | 570 | 25.73 | 3/4 | 48.10 | 1/3 | -22.38 | -10.5% |
| GM Turner | 845 | 46.77 | 5/12 | 36.57 | 3/2 | +10.20 | +4.5% |
| JH Hampshire | 382 | 37.71 | 1/1 | 17.38 | 0/1 | +20.34 | +15.5% |
| MH Denness | 702 | 34.30 | 1/6 | 59.44 | 3/1 | -25.14 | -9.9% |
| CPS Chauhan | 574 | 34.14 | 0/16 | 13.00 | 0/0 | +21.14 | +6.8% |
My very first feature for CW was ‘Series Points‘ in 2008, which represented my preliminary attempt to rate cricketers based on everything they do, and which was based on the points awarded as part of the ICC Test team ratings. Some time later I did a similar thing for the County Championship in England, concentrating on five seasons over the course of its history to illustrate the principles, one of which was 1970. In a year when overseas luminaries such as Asif Iqbal, Mushtaq Mohammad, Rohan Kanhai, Barry Richards, Clive Lloyd and Garry Sobers were gracing the cricket grounds of England, it was Glenn Turner who stood head and shoulders above the rest according to my study. Although his conversion rate in important innings is not high, his average differential is significantly positive.
| Player | ICCrate | iAvg | i100/i50 | rAvg | 100/50 | AvDiff | %iDiff |
| ED Solkar | 521 | 27.08 | 1/5 | 15.50 | 0/1 | +11.58 | +3.8% |
| Sadiq Mohammad | 719 | 39.98 | 5/8 | 23.33 | 0/2 | +16.65 | +8.0% |
| Zaheer Abbas | 808 | 44.37 | 8/13 | 48.00 | 4/7 | -3.63 | -0.5% |
| GR Viswanath | 871 | 45.30 | 13/31 | 29.03 | 1/4 | +16.26 | +6.2 |
| M Amarnath | 720 | 41.15 | 6/21 | 49.00 | 5/3 | -7.85 | -0.7% |
A gaggle of great Asian batsmen next, including the great Zed whose numbers are pretty flat really, as is his conversion rate. Sadiq Mohammad’s numbers show that he deserved his place in the Pakistani side on merit, not just because of his illustrious siblings. Gundappa Viswanath takes the number two spot behind Boycott with 44 important fifties and he has a high average differential to boot.
| Player | ICCrate | iAvg | i100/i50 | rAvg | 100/50 | AvDiff | %iDiff |
| BW Luckhurst | 538 | 35.67 | 3/5 | 38.00 | 1/0 | +14.42 | +4.9% |
| RW Marsh | 599 | 25.63 | 1/8 | 28.88 | 2/8 | -2.64 | -3.8% |
| GS Chappell | 883 | 53.08 | 14/15 | 55.00 | 10/16 | -1.92 | -4.1% |
| KJ O’Keeffe | 297 | 23.54 | 0/1 | 28.17 | 0/0 | -4.63 | -5.4% |
| SM Gavaskar | 916 | 54.72 | 32*/38 | 36.45 | 2/7 | +18.26 | +5.9% |
Two undisputed legends in this group. Greg Chappell, hilariously described by Gideon Haigh as having something of the tin soldier in his bearing, averaged over 53 regardless of the situation and had an excellent conversion rate. But Sunil Gavaskar carried all before him with new records of 32 important tons and 70 important scores over 50, together with a very high average differential.
| Player | ICCrate | iAvg | i100/i50 | rAvg | 100/50 | AvDiff | %iDiff |
| Imran Khan | 650 | 34.75 | 3/12 | 45.00 | 3/6 | -10.25 | -5.7 |
| LG Rowe | 708 | 39.91 | 5/4 | 53.08 | 2/3 | -13.17 | -2.3% |
| AI Kallicharran | 866 | 40.11 | 6/14 | 55.00 | 6/7 | -14.89 | -5.0% |
| AW Greig | 750 | 36.72 | 4/16 | 55.11 | 4/4 | -18.39 | -8.2% |
| R Edwards | 589 | 28.00 | 0/6 | 63.90 | 2/3 | -35.90 | -18.1% |
Not the best group to finish on this time. Lawrence Rowe has a negative average differential but a very good conversion rate, Alvin Kallicharran likewise but a good number of important fifties, ditto Tony Greig, whose England sides were so poor that less than 20% of his innings were played when the team was ahead – no wonder he buggered off to the WSC.
In summary, of these 100 players:-
5 players had an important average over 60 (highest Charlie Davis with 63.94; Sobers was less than half a run away, and Barry Richards averaged 78.75 in 4 Tests)
15 players had an important average over 50
5 players had at least 15 important tons (highest Gavaskar with 32)
29 players had at least 20 important fifties (highest Gavaskar with 70)
9 players had an average differential over 20 (highest Milburn with +40.20)
Naturally the aggregate numbers are higher with these hundred batsmen than the previous hundred, though interestingly the average numbers are lower.
So that’s the first 200 batsmen now covered; in the following feature we’ll look at the next group of 100 top batsmen, from Viv Richards to Andy Flower.


Leave a comment