Series Points (Slight Return)
Dave Wilson |
A while ago I proposed a method of rating Test players which I called Series Points. The idea was to take the points allocated by the ICC Test team rating system developed by David Kendix, which are used to calculate the ongoing rating of each team, and divide those points between the players on a per-series basis based on their performance with bat, ball and in the field.
The advantages of the system are that
– all players can be compared directly independent of discipline
– the team ratings, and hence the player ratings, take into account strength of opposition
– all eras are independent insofar as the rating is dependent on Test team ratings
– all eras are equivalent in that the average Test team ratings is consistent over time, and therefore also the average player numbers
– ratings for players are context-independent at the match level, so a player’s rating is less impacted by the performances of his team-mates
– it’s possible to make all kinds of objective comparisons between groups of players of unrelated disciplines.
The Test team ratings were at that time only available from 2003, so I went back and calculated them from 1877. Converting the team numbers to individual player numbers took a long time, and after posting decade leaders on CricketWeb’s feature pages the composite ratings were also published over a series of articles in the UK cricket magazine, Spin in 2010 (some day soon I’ll bring the llists up to date). The final numbers (correct to that time) are shown below (ISPs – Individual Series Points):-
Aggregate
ISPs Player
2614 Shane Warne (Aus)
2463 Jacques Kalis (SA)
2202 Ricky Ponting (Aus)
2118 Muttiah Muralitharan (SL)
2043 Ian Botham (Eng)
1978 Garry Sobers (WI)
1974 Steve Waugh (Aus)
1968 Sachin Tendulkar (Ind)
1967 Kapil Dev (Ind)
1948 Anil Kumble (Ind)
1861 Alan Border (Aus)
1822 Mark Waugh (Aus)
1784 Viv Richards (WI)
1762 Adam Gilchrist (Aus)
1755 Richard Hadlee (NZ)
1745 Brian Lara (WI)
1736 Glenn McGrath (Aus)
1733 Alec Stewart (Eng)
1721 Shaun Pollock (SA)
1686 Rahul Dravid (Ind)
Points per 5-matches (min 5 series)
PP5M- Player
128.3 George Lohmann (Eng)
119.8 Don Bradman (Aus)
116.5 Sidney Barnes (Eng)
111.9 Jack Gregory (Aus)
107.7 Clarrie Grimmett (Aus)
106.3 Garry Sobers (WI)
102.0 Bobby Peel (Eng)
101.1 Bill Whitty (Aus)
100.1 Ian Botham (Eng)
100.1 Jacques Kallis (SA)
100.1 Adam Gilchrist (Aus)
99.7 Richard Hadlee (NZ)
98.0 Hugh Trumble (Aus)
97.4 Charlie Turner (Aus)
97.1 Harold Larwood (Eng)
97.1 Frank Tyson (Eng)
96.4 Alan Davidson (Aus)
95.0 AG Steel (Eng)
94.3 Richie Benaud (Aus)
94.2 Learie Constantine (WI)
The results were not at all what I expected, and I have to say I wasn’t particularly enamoured with the points per five-matches list (with the possible exception of seeing Learie Constantine so highly ranked, in itself a vindication of one of the advantages of rating players on all disciplines rather than on each in isolation). There is a danger in moments like this to say “Well that can’t be right because so-and-so should be first and he should be higher and that one lower”, then to go in and modify the system to suit the proposition. Very often I have seen people try similar ratings and to conclude that they had spent some time getting something that looks “about right”, but that of course defeats the object of having an objective system. I had spent a lot of time and effort ensuring no subjectivity crept in to my ratings and so I went with what it said – basically it doesn’t matter if I like it or not, as long as I’m satisfied that there is no subjectivity involved. The reason I mention the Spin series is because I spent a great deal of time therein explaining and justifying the results.
One obvious conclusion is that recent players dominate the aggregate list, many more Tests being played nowadays than compared with e.g. Bradman’s time. The second obvious thing to note is that there is a large number of bowlers who feature highly in the PP5M list, particularly a large number of pre-WW1 bowlers, with Lohmann at the head. This could be a result of what evolutionary biologist Stephen Jay Gould noted as the “shrinking variation” between the best and worst players.
Again I had no particular objection to bowlers being more highly ranked per se, for various reasons, partly that bowlers in general contribute in more ways than batsmen do, partly that fewer bowlers share wickets than batsmen share runs. If that was all it was I’d have left it there.
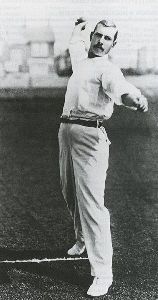
However, what the above per-match list is saying is that five of the top 13 players in Test cricket history were turn of the century bowlers; I just couldn’t accept that this is the case. Bowlers in that era certainly had more actual value than in later years, but should that be enough to allow them to dominate the lists?
So I gave this a great deal of thought and realised a few things which I’d missed before. First, there is the variation in dismissal types through the ages. If we plot the percentage of wickets which are unassisted (i.e. bowled, lbw, no fielder involved), there is a fairly slow decline from the late 19th-century through the 1950s, after which there is a dramatic decline until the 1970s, since when levels have remained constant. There are a number of factors which probably explain this, including the gradual change in new ball availability (55 overs in 1946 increasing to 85 in 1967) and the modifications of technique as the result of the introduction of one day cricket. So there are far more assisted wickets these days than there were in Lohmann’s day, with the knock-on effect that bowlers in his era get a higher points share than in later times, when more points go to the fielders.
Another issue is the division of labour and resultant changing opportunities; prior to WW1 the percentage of the bowling favoured the opening bowlers to a much higher degree, as often there would only be three and sometimes even just two bowlers used for a complete innings. In the 19th-century opening bowlers were responsible for close to 60% of the bowling, whereas since WW1 the average is around 40%, and this should be adjusted for. There is no equivalent change in opportunity for batsmen, as there have always been eleven to share the load. The adjustment for bowlers is heavier before 1890 and declines gradually to 1914, so that from 1920-onwards no adjustment is made. The adjusted PP5M figures are shown below:-
Points per 5-matches (min 5 series)
PP5M Player
119.8 Don Bradman (Aus)
111.9 Jack Gregory (Aus)
107.7 Clarrie Grimmett (Aus)
106.3 Garry Sobers (WI)
100.1 Ian Botham (Eng)
100.1 Jacques Kallis (SA)
100.1 Adam Gilchrist (Aus)
99.7 Richard Hadlee (NZ)
97.1 Harold Larwood (Eng)
97.1 Frank Tyson (Eng)
96.4 Alan Davidson (Aus)
95.6 Sidney Barnes (Eng)
94.3 Richie Benaud (Aus)
94.2 Learie Constantine (WI)
94.1 Keith Miller (Aus)
93.1 George Lohmann (Eng)
92.8 Bill O’Reilly (Aus)
92.7 Shane Warne (Aus)
Barnes has dropped to 12th, but Lohmann has fallen to a more significant degree from 1st to 18th with the rest of the pre-WW1 bowlers dropping out of the top 20. Of this list the most contentious ranking would undoubtedly be Clarrie Grimmett, as generally Bill O’Reilly is considered to have been better. One of the main reasons O”Reilly is rated higher is I think down to Bradman and his lower regard for Grimmett, coupled with the fact that Grimmett took more wickets against South Africa. What people tend to do is state that fact and then totally disregard those South African wickets when comparing them (even though O’Reilly played in most of those matches and didn’t take as many wickets) – obviously they were worth something, and this system puts an objective value on that. I find it a little dubious that if O’Reilly was significantly better than Grimmett it wouldn’t be reflected in their performances. Having said that, I’m not convinced Grimmett is the third-best Test player ever, so it may be a case of back to the drawing board to find out why he rates so highly. Or am I falling into the trap I cautioned against above?
Besides, I can’t believe the top three players ever were Australian – must have forgotten to carry a one somewhere.


Leave a comment