Anatomy of a Winner
Dave Wilson |
Anatomy of a Winner
Not So Sunny for Brian
I have been surprised in the past by how little team success which batsmen of the calibre of Brian Lara and
Sunil Gavaskar have met with, so I was interested to find out which batsmen have been the most successful in terms of turning big innings into wins for their team; not those with the best average necessarily, as we’re only talking about Tests which their team won, but those whose big innings have made the most difference in terms of actually winning Tests (which, after all, is the point).
What’s the Difference?
First, we need to define what a difference-making innings is. This is not easy to quantify objectively; if you look at a scorecard a particular innings may stand out as the difference-maker or it may stand out as being even more dominant than that. To give a fairly recent example, Virender Sehwag scored 201*, carrying his bat against Sri Lanka in July/August 2008, that being the only innings over 100 in the match, which India went on to win by 170 runs. Another point to make here is that a winning innings isn’t necessarily one which snatches victory from the jaws of defeat right at the end of the game – that’s obviously the most visible type of winning innings, but Sehwag’s innings, laying the foundation for victory right from the start, was clearly a winning innings too. An example of a less dominant innings which nonetheless was the difference-maker is Kumar Sangakarra’s 152 against England in December 2007, which Sri Lanka won by 88 runs (he also scored 92 in the first innings).
Totally Winning
The only way to gather this information was to look at each of the scorecards in all Tests which produced a result, starting from the first ever Test match (1329 Tests all told which weren’t drawn or tied), to determine the difference-making innings in each win (if any – an all-round team performance may not have a specifically identifiable difference-maker).
The resulting list was used to identify the top players who have produced the most winning innings – here are the top batsmen in terms of total winners:-
| Player | Matches | Total | Percent Games |
| Don Bradman (Aus) | 52 | 11 | 21.15% |
| Steve Waugh (Aus) | 168 | 11 | 6.55% |
| Kumar Sangakkara (SL) | 78 | 10 | 12.82% |
| Ricky Ponting (Aus) | 127 | 10 | 7.67% |
| Neil Harvey (Aus) | 79 | 6 | 7.59% |
| Mahela Jayawardene (SL) | 100 | 6 | 6.00% |
| Gordon Greenidge (WI) | 108 | 6 | 5.56% |
| Graham Gooch (Eng) | 118 | 6 | 5.08% |
| Clem Hill (Aus) | 49 | 5 | 10.20% |
| Mohammad Yousuf (Pak) | 79 | 5 | 6.33% |
| Wally Hammond (Eng) | 85 | 5 | 5.88% |
| Greg Chappell (Aus) | 87 | 5 | 5.75% |
| Justin Langer (Aus) | 105 | 5 | 4.76% |
| Inzamam-ul-Haq (Pak) | 120 | 5 | 4.17% |
| Rahul Dravid (Ind) | 129 | 5 | 3.88% |
| Marcus Trescothick (Eng) | 76 | 4 | 5.26% |
| Len Hutton (Eng) | 79 | 4 | 5.06% |
| Marvan Atapattu (SL) | 90 | 4 | 4.44% |
| Herschelle Gibbs (SA) | 90 | 4 | 4.44% |
| Sanath Jayasuriya (SL) | 110 | 4 | 3.64% |
| Viv Richards (WI) | 121 | 4 | 3.31% |
| Mark Waugh (Aus) | 128 | 4 | 3.13% |
| Brian Lara (WI) | 131 | 4 | 3.05% |
| Sachin Tendulkar (Ind) | 155 | 4 | 2.58% |
Total – number of winning innings
Percent Games – total expressed as a percentage of matches played
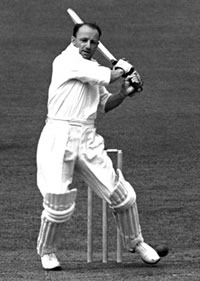
Of course, The Don is in pole position. Australian great Steve Waugh is in second, although he played in more than three times as many Tests as Bradman. Kumar Sangakarra is very highly ranked here, as is another current player, Ricky Ponting. Australian favourite Neil Harvey comes in fifth. Lara barely makes this list, and a quick perusal of his batting analysis shows that the majority of his big innings were made in games which West Indies either drew or lost; the same thing also applies to Tendulkar.
Percentage Cricket
The list above, which is based on totals, is skewed somewhat towards modern players, as they play in more Tests
than their predecessors. We can re-sort based on the percentage of matches in which the player produced a
winning innings, shown below (minimum 3 winning innings):-
| Player | Matches | Percent Win |
| Don Bradman (Aus) | 52 | 21.15% |
| Kumar Sangakkara (SL) | 78 | 12.82% |
| Clem Hill (Aus) | 49 | 10.20% |
| Ricky Ponting (Aus) | 127 | 7.87% |
| Neil Harvey (Aus) | 79 | 7.59% |
| Steve Waugh (Aus) | 168 | 6.55% |
| Arthur Morris (Aus) | 46 | 6.52% |
| AB de Villiers (SA) | 46 | 6.52% |
| Ashwell Prince (SA) | 47 | 6.38% |
| Mohammad Yousuf (Pak) | 79 | 6.33% |
| Mahela Jayawardene (SL) | 100 | 6.00% |
| Wally Hammond (Eng) | 85 | 5.88% |
| Graham Gooch (Eng) | 118 | 5.08% |
| Len Hutton (Eng) | 79 | 5.06% |
| Jack Hobbs (Eng) | 61 | 4.92% |
| Justin Langer (Aus) | 105 | 4.76% |
| Virender Sehwag (Ind) | 64 | 4.69% |
| Marvan Atapattu (SL) | 90 | 4.44% |
| Herschelle Gibbs (SA | 90 | 4.44% |
| Inzamam-ul-Haq (Pak) | 120 | 4.17% |
Once again, Bradman is miles ahead of the rest. Sangakkara moves up to second, and Golden Age great Clem Hill comes in at third. The majority of players featured here played (or play) in times when games were more regularly played to a finish.
Totally Dominant
If we further refine the list to show the more dominant innings made during wins, we have the following:-
| Player | Dom. | Percent Dom |
| Don Bradman (Aus) | 8 | 15.38% |
| Kumar Sangakkara (SL) | 7 | 8.97% |
| G Chappell (Aus) | 5 | 4.63% |
| Greenidge (WI) | 5 | 7.87% |
| Hutton (Eng) | 4 | 5.06% |
| Atapattu (SL) | 4 | 4.44% |
| Jayawardene (SL) | 4 | 4.00% |
| S Waugh (Aus) | 4 | 2.38% |
| Smith (SA) | 3 | 4.17% |
| Mohammad Yousuf (Pak) | 3 | 3.80% |
| Hammond (Eng) | 3 | 3.53% |
| Hayden (Aus) | 3 | 3.00% |
| Gooch (Eng) | 3 | 2.54% |
| Inzamam-ul-Haq (Pak) | 3 | 2.50% |
| Richards (WI) | 3 | 2.48% |
| Javed Miandad (Pak) | 3 | 2.42% |
| Dravid (Ind) | 3 | 2.33% |
| Lara (WI) | 3 | 2.29% |
%Dom refers to the percentage of matches in which the player had a dominant performance.
Greg Chappell now moves up to the top three with Gordon Greenidge just behind. The mercurial Marvan Atapattu also features more highly in terms of dominating performances in won games.
There’s No ‘I’ in Team (But There Is One in ‘Dominant’)
Now we have to ask the question – how much of this is due to the player’s team just being very good and hence winning more games? To check this, we can run a further refinement, showing the player’s dominant performances as a percentage of the team wins during his career. The revised list is shown below:-
| Player | Dom. | Tm Wins | Percent of Tm WIns |
| Don Bradman (Aus) | 8 | 32 | 25.00% |
| Kumar Sangakkara (SL) | 7 | 35 | 20.00% |
| Len Hutton (Eng) | 4 | 27 | 14.81% |
| G Chappell (Aus) | 5 | 38 | 13.16% |
| Marvan Atapattu (SL) | 4 | 31 | 12.90% |
| Wally Hammond (Eng) | 3 | 29 | 10.34% |
| Graham Gooch (Eng) | 3 | 32 | 9.38% |
| Mohammad Yousuf (Pak) | 3 | 32 | 9.38% |
| Brian Lara (WI) | 3 | 32 | 9.38% |
| Mahela Jayawardene (SL) | 4 | 44 | 9.09% |
| Gordon Greenidge (WI) | 5 | 57 | 8.77% |
| Virender Sehwag (Ind) | 2 | 24 | 8.33% |
| Graeme Smith (SA) | 3 | 39 | 7.69% |
| Javed Miandad (Pak) | 3 | 39 | 7.69% |
| Arthur Morris (Aus) | 2 | 27 | 7.41% |
| Jack Hobbs (Eng) | 2 | 28 | 7.14% |
| Rahul Dravid (Ind) | 3 | 43 | 6.98% |
| Garry Sobers (WI) | 2 | 31 | 6.45% |
| David Gower (Eng) | 2 | 32 | 6.25% |
| Inzamam-ul-Haq (Pak) | 3 | 49 | 6.12% |
Even though Bradman played in some great Australian sides, he is still top man. Certainly this list contains some of the more epic Test batsmen. However, there are some players missing whom we might expect to feature:- at number 23 is Viv Richards, whose West Indian team was particularly noted for its bowling prowess; Sachin Tendulkar languishes at 35, and its notable that Sehwag and Dravid finish ahead using this measure.
Searchin’ for Sachin
Considering Tendulkar in particular, what we’ll do next time is look at how many wins the players should have finished with, based on their most notable performances.


Leave a comment