Improving the ICC Test Team Rating System
Dave Wilson | A little while ago (2008), I wrote an article in which I applied the ICC rating system back to 1877 to determine the strength of opposition for a player-ratings system, an offshoot of which was I could then also identify which was the best ever Test team. The original article was summarised for Cricket Web| Points | Margin | Team | Peak Year | # of teams |
| 143 | +34 | Australia | 2007-08 | 10 |
| 134 | +21 | Australia | 1959-60 | 7 |
| 133 | +25 | Australia | 1951-52 | 6 |
| 132 | +29 | West Indies | 1985-86 | 7 |
| 131 | +22 | West Indies | 1964-65 | 7 |
| 130 | +41 | Australia | 1924-25 | 3 |
| 127 | +70 | England | 1890 | 3 |
| 125 | +29 | Australia | 1935-36 | 6 |
| 125 | +8 | South Africa | 1969-70 | 7 |
| 125 | -5 | Australia | 1962-63* | 7 |
| 124 | +25 | Australia | 1975-76 | 6 |
| 122 | +19 | England | 1956 | 7 |
| 122 | +19 | England | 1971 | 6 |
| 122 | +8 | West Indies | 1993-94 | 9 |
| 121 | +34 | England | 1928-29 | 4 |
| 121 | -5 | South Africa | 2008-09* | 9 |
| 121 | -7 | West Indies | 1948* | 6 |
| 120 | +17 | West Indies | 1977-78 | 6 |
(The table shows peak points rating, margin above second-placed team, the team, year peak points was achieved and the number of Test-playing nations at that time.)
* High scores by second-ranked teams. Australia were the highest-rated second-place team ever, behind the 1962-63 West Indians (130, peaking in 1964-65 with 131); other high-ranking runners-up include the 2007-08 South Africa team (second to Australia’s 126) and the West Indies, second to the 1948 Australians (128, who peaked with 133 in 1951- 52)
Setting The Record Straight
Since researching the original article, however, I’ve come to realise the shortcomings of the ICC system, which I feel are twofold:
1. the existing system does not differentiate between a home series win and an away series win
Since Test matches began, only one country can boast an overall winning record away from home – Australia (0.559); every other country is below 0.500, the average record of the other teams being 0.365, so clearly it is more difficult to win away (incidentally, Australia’s home record is 0.700). By contrast, between 1976 and 1988-89 West Indies won no fewer than nine overseas series, compiling a win percentage of 0.725 away from home. This level of overseas dominance, being rare and as such a better indication of true dominance, should be rewarded.
2. the existing system does not take into account the degree of dominance
In 2002, Australia beat South Africa by an innings and 360 runs while losing only seven wickets – this scores exactly the same as the 2-run game between Australia and England in 2005, i.e. one point for a win. Looking from a series perspective, in 1983-84 the West Indies beat Australia 3-0 without losing a single second-innings wicket, posting runs-per-wicket (RPW) of 48.7 as against 25.0; in 1901-02 Australia beat England 4-1 yet barely outscored England and lost only one fewer wicket. Yet both of these series register as exactly the same margin in series points, i.e 5-1. This is unfair and should be accounted for in the system.
Outright Dominance
So, to take into account the above I re-ran the system ratings with the following modifications:
1. an away series win was awarded an additional series point, and
2. the degree of dominance was used to offset the total series points awarded.
Note that the degree of dominance is only factored in if the dominance (measured by ratio of runs per wicket of the two teams) is significant. The ratio is also offset on a per-era basis, as the level of home dominance has varied over the years.
The two systems, original and revised, are compared in the chart below. This chart shows the relative dominance, i.e. separation of first and second teams ratings points, plotted against time (this chart shows dominance only since 1930, since when there have been at least five Test-playing nations, as it was less difficult to dominate only two other teams prior to that):
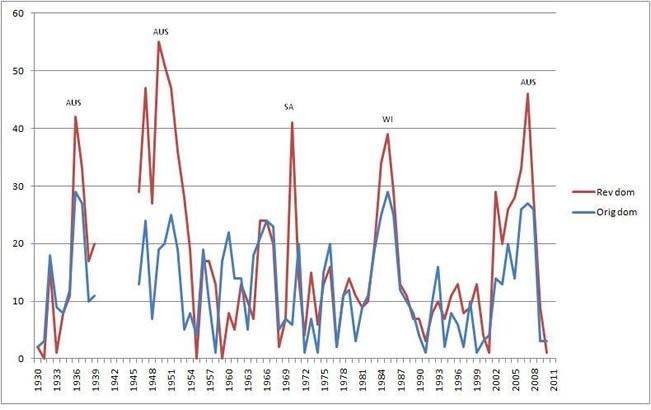
What we can see here is that the more dominant teams, i.e. late-1940s Australians, late 1960s South Africans, 1980s West Indians and 2000s Australians, have much higher margins over second place than previously, which more realistically measures their level of dominance. Take as an example the 1948 Australians, considered by many (including their captain, Don Bradman) to have been the greatest Test team ever – in the revised system they are seen to have been the most dominant side in history, whereas in the original system they are not seen to have been as dominant as, for instance, the 1937 Australians. At other points in history, where no one team particularly dominated, the levels are about the same for both systems.
The revised system throws up some interesting aspects as compared to the current system. For example, using the original system South Africa rated as top team in 1909-10 and 1930-31, though not with the revised system, which rewards more dominant performance scores – they arguably didn’t deserve to be top ranked either of those times. Australia’s Invincibles originally rate at 128 points after their comprehensive victory in England, but at 150 points with the revised system (the other ranked teams rate at about the same). Pakistan does not rank as number one team at any point using the current system, however the revised system shows Pakistan as top side on no fewer than three separate occasions – 1990-1, 1992 and 1994-5, by a single point each time in very competitive circumstances:
| 1990-1 | |
| (Pak 1-1 WI) | |
| PAKISTAN | 123 |
| West Indies | 122 |
| Australia | 118 |
| India | 104 |
| England | 98 |
| New Zealand | 94 |
| Sri Lanka | 70 |
| 1992 | |
| (Pak 2-1 Eng) | |
| PAKISTAN | 126 |
| Australia | 125 |
| West Indies | 122 |
| England | 109 |
| India | 94 |
| Sri Lanka | 86 |
| New Zealand | 78 |
| 1994-5 | |
| (Ind 1-1 WI) | |
| PAKISTAN | 129 |
| Australia | 128 |
| West Indies | 124 |
| India | 122 |
| South Africa | 114 |
| England | 95 |
| New Zealand | 84 |
| Sri Lanka | 66 |
| Zimbabwe | 56 |
Competitive Balance
The strongest era under the new system was the mid-nineties, when there were five teams rated at 120 or higher:
| 1994-5 | |
| (Aus 3-1 Eng) | |
| AUSTRALIA | 127 |
| Pakistan | 126 |
| West Indies | 124 |
| India | 122 |
| South Africa | 120 |
| England | 100 |
| New Zealand | 82 |
| Sri Lanka | 66 |
| Zimbabwe | 56 |
| 1994-5 | |
| (Wind 1-0 over Nzl) | |
| WEST INDIES | 129 |
| Australia | 127 |
| Pakistan | 126 |
| India | 122 |
| South Africa | 120 |
| England | 100 |
| New Zealand | 79 |
| Sri Lanka | 66 |
| Zimbabwe | 56 |
| 1994-5 | |
| (Aus 2-1 over Wind) | |
| AUSTRALIA | 131 |
| Pakistan | 124 |
| West Indies | 124 |
| India | 122 |
| South Africa | 120 |
| England | 100 |
| New Zealand | 75 |
| Sri Lanka | 71 |
| Zimbabwe | 60 |
Although we currently have five strong teams now, they are not all rated as highly as the five shown above.
Best of the Best
Here then are the highest-rated teams of all time using the revised method. Because of the additional away series multiplier and the dominance factor, the ratings points using this method are higher than those of you who are familiar with the ICC Test rankings are probably used to. That said, here is the revised list of top-rated teams through the ages:
| Points | Margin | Team | Peak Year | # of teams |
| 170 | +51 | South Africa | 1969-70 | 7 |
| 168 | +46 | Australia | 2007-08 | 9 |
| 167 | +55 | Australia | 1949-50 | 6 |
| 156 | +29 | Australia | 2002-03 | 7 |
| 153 | +39 | West Indies | 1985-86 | 7 |
| 148 | +24 | West Indies | 1964-65 | 7 |
| 148 | +8 | Australia | 1959-60 | 7 |
| 142 | +5 | India | 2010-11 | 9 |
| 140 | +1 | South Africa | 2010 | 9 |
| 140 | 0 | England | 1959* | 7 |
| 139 | +42 | Australia | 1935-36 | 6 |
| 139 | +21 | Australia | 1975-76 | 6 |
| 139 | +13 | Australia | 1996-97 | 9 |
| 136 | +6 | South Africa | 2000-01 | 10 |
| 135 | -21 | South Africa | 2003** | 10 |
| 134 | +22 | England | 1971 | 6 |
| 134 | +14 | West Indies | 1977-78 | 6 |
| 134 | +10 | West Indies | 1993-94 | 9 |
* England was tied on 140 points with Australia.
** South Africa is the only second-placed team which is ranked here, 19 points behind Australia’s 154.
Note: the previous article was written prior to India’s ascendency as world leader.
We now see the 1969-70 South Africans assuming the mantle of highest rated Test team, which probably merits some discussion. This team, including such luminaries as Mike Procter, Eddie Barlow, Graeme and Peter Pollock, Denis Lindsay, Trevor Goddard and Barry Richards, while generally considered to be one of the finest Test sides ever is not typically described as the very best ever. Their high rating is partly explained by how the system was designed to work – the system was conceived in the early 2000s and was based on the fact that teams were by then playing many Test series in a 3-4 year period, as many as 45-50 Tests against nine different opponents, whereas in the period covered to determine the rating of this South Africa side they had played only two winning series and nine Tests, all against Australia. Their 7-1-1 record against a good Aussie side means they score very highly, but the lack of variation of opponents must be taken into account when considering the best ever team, though they are probably deserving of a top five spot.
Australia’s 2007-08 vintage ranks just two points below the South Africans – a 3-0 win in Pakistan saw the 2000s Aussies go over 150 points for the first time, and they were able to maintain around that level or better for seven years. Considering that only five teams ever rated at higher than 150, this is an incredible level of sustained domination. After that we see what is basically the 1948 Invincibles, which peaked after their heavy defeat of South Africa following the domination of England, then the 2002-03 Aussies and the 80s Windies rounding out the top five. The 1959-60 Aussies drop down to seventh, probably a fairer reflection of their greatness than the original second place. Compared to the original ranking, this revised system, which takes into account better performances away from home and also dominating performances, gives a ranking list which concurs more closely with generally accepted opinion on the greatest ever Test teams, the top-ranked team notwithstanding.
The best ever ratings for those countries not listed above are:
Pakistan 129 (1994-95, second place to Aus on 133); note also 126 (1992, but first place by 1pt over Aus)
New Zealand 120 (1986-87, second place to WI on 140)
Sri Lanka 115 (1999-00, third place); 115 (2010, fourth place)
Zimbabwe 83 (1999-00, ninth place)
Bangladesh 12 (2009-10, ninth place)
The Strong Get Stronger
Considering that the 2000 Aussie sides dominated so may opponents for so long, I’d still have to say the conclusion of the original article was correct, i.e. the 2007-08 Aussies deserved to be the highest rated. I do feel that the revised system more accurately measures the relative strength of sides as compared to the current system, in that more dominant sides distance themselves to a greater degree, and is therefore a fairer reflection of the relative dominance of great teams. Which is, after all, the point of a rating system.


[QUOTE=Blaze 18;2409369]That is a good piece. I agree that there should be a distinction between home and away victories. I am not too sure about awarding more points for a higher margin of victory though. It does have some merit, but it is not a change that I would want to see.[/QUOTE]
Isn’t that done already? I was always under the impression that away victories get extra credit in tests but not in ODIs.
On giving more points for higher margin, that might result in situations where a team that loses a series 1-2 ends up snapping up more points for the series for winning the only match by an innings and 200 runs while losing the other two by small margins.
Comment by 8ankitj | 12:00am GMT 15 December 2010
Yep I remember researching that a while ago, and the current system doesn’t discriminate between home/away matches. That definately has to be changed, because almost every team has considerably more success on home soil than away.
Comment by DeusEx | 12:00am GMT 15 December 2010
That is a good piece. I agree that there should be a distinction between home and away victories. I am not too sure about awarding more points for a higher margin of victory though. It does have some merit, but it is not a change that I would want to see.
Comment by Blaze 18 | 12:00am GMT 15 December 2010
Crazy that SA needs to win all 3 tests to become the no. 1 ranked team
1-0 or better would be more than enough IMO
Comment by social | 12:00am GMT 15 December 2010
“They lost to Australia and drew against England at home. Why would a 1-0 win at home now be more than enough?”
Who has India EVER beaten away?
If SA beat them at home after drawing away, then there should be no argument
Comment by social | 12:00am GMT 15 December 2010
They lost to Australia and drew against England at home. Why would a 1-0 win at home now be more than enough?
Comment by G.I.Joe | 12:00am GMT 15 December 2010
So were India #1 after drawing in Australia in 2004?
Comment by G.I.Joe | 12:00am GMT 15 December 2010
[QUOTE=8ankitj;2409370]Isn’t that done already? I was always under the impression that away victories get extra credit in tests but not in ODIs.
On giving more points for higher margin, that might result in situations where a team that loses a series 1-2 ends up snapping up more points for the series for winning the only match by an innings and 200 runs while losing the other two by small margins.[/QUOTE]
Thanks for reading and commenting, 8ankitj. Actually in the scenario you mention the dominance adjustment wouldn’t even kick in; the dominance is assessed on a per-series basis so one team really has to be dominant in all games of the series. Also, by far the majority of the points sharing is based on who wins the series, so the series winner would always get more points.
Comment by chasingthedon | 12:00am GMT 15 December 2010
[QUOTE=Blaze 18;2409465]I read somewhere that India will retain the number one ranking even if they lose all the three tests.[/QUOTE]
[QUOTE=social;2409457]Crazy that SA needs to win all 3 tests to become the no. 1 ranked team
1-0 or better would be more than enough IMO[/QUOTE]
With the revised system, South Africa would go top ahead of India with a 1-0 series win.
Comment by chasingthedon | 12:00am GMT 15 December 2010
[QUOTE=Cruxdude;2409511]Would a home loss affect your rating more than an away loss?[/QUOTE]
If I understand your question correctly, you want to know how a team’s rating is affected by a home loss as opposed to an away loss?
For a home loss, you would score less points/match than for the equivalent result away; likewise, the away winner would score more points/match than the home winner.
Comment by chasingthedon | 12:00am GMT 15 December 2010
Would a home loss affect your rating more than an away loss?
Comment by Cruxdude | 12:00am GMT 15 December 2010
[QUOTE=G.I.Joe;2409480]They lost to Australia and drew against England at home. Why would a 1-0 win at home now be more than enough?[/QUOTE]
Simple, because they’re not India and thus get rated higher by some people.
I’d say it’s perfectly fair that SA need a big win to displace India because their recent results haven’t actually been that good.
Comment by marc71178 | 12:00am GMT 15 December 2010
“Not to mention New Zealand and West Indies. Throw in Sri lanka as well if drawn series count.”
Debatable. If India’s drawn series in Australia (2003-2004) should not count because of slow, dead pitches and the absence of two key players, then South Africa’s drawn series in India earlier this year should also be taken with a pinch of salt.
In general SA’s away performances have been very good over the past few years, so if they beat India at home, it should give them the nod in most neutrals’ eyes.
Comment by vcs | 12:00am GMT 16 December 2010
Yeah, draw or better and India will have done enough.
Comment by vcs | 12:00am GMT 16 December 2010
Yes, I agree with that. However, a drawn series should give India the nod in my opinion. People should not come out and say ” they only drew against a side without X and Y”.
Comment by Blaze 18 | 12:00am GMT 16 December 2010
Yeah good call. Once we beat you next year it’ll be clear that India are #1, as South Africa were unable to beat you lot at home, and we’ll have beaten you home and away.
Comment by Jono | 12:00am GMT 16 December 2010
England will settle this #1 debate soon enough anyway. 🙂
Comment by GeraintIsMyHero | 12:00am GMT 16 December 2010
And their home performances have correspondingly been poor. So they aren’t any more deserving of the title with a weak 1-0 home win than any other team.
Comment by G.I.Joe | 12:00am GMT 16 December 2010
It’s bad enough having India as no1, let alone England. I guess it coves up all the other problems with that atrocious country
Comment by Got_Spin | 12:00am GMT 16 December 2010
Clown.
We will make the paddling we’ve given the filth look like a close victory when we hammer your overrated prima donnas next summer.
Comment by GeraintIsMyHero | 12:00am GMT 16 December 2010
Haha, I actually do tend to think that England could be the long-term #1. Their side is fairly young (well, there’s no big names likely to retire soon in contrast to India and SA), you’re the only side to have the wood on us in Australia, and you seem to lack weaknesses.
Comment by morgieb | 12:00am GMT 16 December 2010
SA never really dominated us = twice. Australia were in a winning position and blew it. Right now England dominated us in the 2nd test, and quite probably will in the 3rd test.
Comment by morgieb | 12:00am GMT 16 December 2010
England have been performing tremendously well for the past year or so but let’s wait a bit. SA did beat Australia in Australia on their last visit…
Comment by vcs | 12:00am GMT 16 December 2010
Have to say the most impressive thing about this English side is the way they’ve kept up a very high level of performance right throughout this series after day 1 in Brisbane (and you could argue that was down to a freakish spell by Siddle more than anything else). Hardly any let-downs.
Comment by vcs | 12:00am GMT 16 December 2010
[QUOTE=chasingthedon;2409503]Thanks for reading and commenting, 8ankitj. Actually in the scenario you mention the dominance adjustment wouldn’t even kick in; the dominance is assessed on a per-series basis so one team really has to be dominant in all games of the series. Also, by far the majority of the points sharing is based on who wins the series, so the series winner would always get more points.[/QUOTE]
Sorry, didn’t read the article. FWIW I commented only after reading Blaze’s post :p
Comment by 8ankitj | 12:00am GMT 16 December 2010
[QUOTE=morgieb;2410779]Haha, I actually do tend to think that England could be the long-term #1. Their side is fairly young (well, there’s no big names likely to retire soon in contrast to India and SA), you’re the only side to have the wood on us in Australia, and you seem to lack weaknesses.[/QUOTE]
I agree. There is every chance of England becoming the best side in the world in two years time.
Comment by Blaze 18 | 12:00am GMT 16 December 2010
[QUOTE=vcs;2410783]England have been performing tremendously well for the past year or so but let’s wait a bit. SA did beat Australia in Australia on their last visit…[/QUOTE]
They lost at home though, England did not.
Comment by Blaze 18 | 12:00am GMT 16 December 2010
Nah, will be a while before that get’s boring.
Always said Hoe was a top bloke.
Comment by marc71178 | 12:00am GMT 16 December 2010
I [U]like[/U] England (bar Broad). All top blokes.
I love watching them bowl (even Broad). Exciting stuff.
I don’t necessarily like watching them bat though. Eventually 500 runs between Strauss, Cook and Trott can really get on your nerves. :ph34r:
Comment by Jono | 12:00am GMT 16 December 2010
As a semi-England supporter, I’d be very surprised if England didn’t take the #1 ranking off of us tbh, especially when Tendulkar/Dravid/Laxman/Sehwag/Zaheer start the retirement procession.
Comment by G.I.Joe | 12:00am GMT 16 December 2010
[QUOTE=vcs;2411190]I thought better of you, Joe… :no:[/QUOTE]
What’s wrong with the English team? :p
Comment by G.I.Joe | 12:00am GMT 16 December 2010
[QUOTE=G.I.Joe;2411073]As a [B]semi-England supporter[/B], I’d be very surprised if England didn’t take the #1 ranking off of us tbh, especially when Tendulkar/Dravid/Laxman/Sehwag/Zaheer start the retirement procession.[/QUOTE]
I thought better of you, Joe… :no:
Comment by vcs | 12:00am GMT 16 December 2010
[QUOTE=G.I.Joe;2411198]What’s wrong with the English team? :p[/QUOTE]
The fact that they’re good these days…. :ph34r:
Nah, seriously, it’s just taking a bit of getting used to, that’s all. :p
Comment by vcs | 12:00am GMT 16 December 2010