Zero to Sixty – the third hundred, from Richards to Flower
Dave Wilson |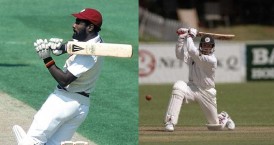
This feature expands on my previous articles, Zero to Sixty – Important Runs in Test Cricket, Zero to Sixty – the First Hundred from Grace to Worrell and Zero to Sixty – the Second Hundred, May to Gavaskar. These articles summarise the performances of top batsmen throughout Test history when their team’s win expectation was 60% or less when they came into bat, i.e. behind or in the balance. Below are the details of the third hundred batsmen under review.
The tables below are basically split chronologically into groups of five batsmen, showing the Player name, peak ICC rating, Average of important innings, total number of important hundreds and fifties, Average of regular innings, total number of regular hundreds and fifties, the differential between important and regular averages and the difference between the number of important runs scored as a percentage of all runs and the number of important innings as a percentage of all innings. An asterisk shows a new high in the particular category of important hundreds.
| Player | ICCrate | iAvg | i100/i50 | rAvg | 100/50 | AvDiff | %iDiff |
| RJ Hadlee | 562 | 27.73 | 1/11 | 26.45 | 1/4 | +1.28 | -2.0% |
| Wasim Raja | 707 | 40.69 | 4/15 | 23.05 | 0/3 | +17.64 | +7.6% |
| BD Julien | 533 | 30.14 | 1/1 | 31.71 | 1/2 | -1.57 | -4.2% |
| JV Coney | 702 | 43.22 | 3/11 | 27.81 | 0/5 | +15.41 | +8.9% |
| BL Cairns | 318 | 15.51 | 0/2 | 18.64 | 0/0 | -3.13 | -5.0% |
Though ostensibly a bowling all-rounder, it’s interesting to look at how Richard Hadlee‘s batting evolved using this measure. For his first 40 Tests, his numbers for situational average were 23.13/20.36/+2.77, for the last 46 they were 33.70/28.41/+5.29 – all of this batting numbers improved. According to Cornered Tigers author Adam Licudi, Wasim Raja ‘revelled in adversity’, and certainly his important numbers reflect that – for example, he notched six fifties in one series in the West Indies, including an undefeated ton, while facing the likes of Andy Roberts, Colin Croft and Joel Garner. Similarly Jeremy Coney; according to Christopher Martin-Jenkins, ‘[Coney] tended to produce his best when the chips were down’; in the most famous example, coming into bat in the third innings with four wickets down and still 80 behind England in Wellington, he hit 174* to save the match.
| Player | ICCrate | iAvg | i100/i50 | rAvg | 100/50 | AvDiff | %iDiff |
| CG Greenidge | 844 | 48.85 | 15/21 | 37.03 | 4/13 | +11.81 | +5.2% |
| IVA Richards | 938 | 53.67 | 17/30 | 45.54 | 7/15 | +8.13 | +2.4% |
| AD Gaekwad | 275 | 29.73 | 1/9 | 31.82 | 1/1 | -2.09 | +0.7% |
| RB McCosker | 641 | 39.15 | 2/7 | 40.36 | 2/2 | -1.21 | +4.3% |
| GP Howarth | 804 | 36.21 | 6/10 | 20.13 | 0/1 | +16.08 | +6.8% |
Gordon Greenidge was one half of the most dominant opening partnership ever, as I showed in this feature. It’s amazing to consider that he and Viv Richards debuted in the same match. Although somewhat unfairly jettisoned from both country and county, Geoff Howarth enjoyed a double century stand with Jeremy Crowe in his final Test innings against Marshall, Garner and Walsh.
A closer look at Viv Richards
Although I was always impressed by Greenidge, I was still surprised to see him with a higher average differential than Richards – it’s important to emphasise here that we are in no way implying that Greenidge outranks Richards; Richards surpasses Greenidge in every category be it average, or hundreds and fifties, in each situation. What I’m trying to get at with this study is that there may be more to a batting average or conversion rate than meets the eye. Nonetheless, I still expected Richards to outstrip Greenidge in average differential, so why doesn’t he?
Richards had a Test career of two (almost) equal halves – below shows the details in terms of important innings:-
| Tests | iAvg | i100/i50 | rAvg | 100/50 | AvDiff | %iDiff |
| 1-70 | 58.07 | 13/14 | 45.57 | 4/8 | +12.50 | +5.2% |
| 71-121 | 46.85 | 4/16 | 52.64 | 3/7 | -5.79 | -5.3% |
Richards exhibited a turnaround in average differential of -18.29 from his first 70 Tests to his last 50; he was massive when the chips were down for the first nine years or so of his Test career, less so after that.
| Player | ICCrate | iAvg | i100/i50 | rAvg | 100/50 | AvDiff | %iDiff |
| GA Gooch | 873 | 42.63 | 16/38 | 43.44 | 4/8 | -0.81 | +0.6 |
| DS Steele | 643 | 38.29 | 1/4 | 68.50 | 0/1 | -30.21 | -7.9% |
| RA Woolmer | 642 | 35.29 | 3/2 | 17.75 | 0/0 | +17.54 | +8.0% |
| GN Yallop | 710 | 42.54 | 6/7 | 39.95 | 2/2 | +2.59 | +2.9% |
| DB Vengsarkar | 837 | 42.03 | 13/29 | 43.82 | 4/6 | -1.79 | +0.1% |
Graham Gooch knocked up 54 important fifties in his Test career, fourth all-time at that stage – at one point Gooch had to endure 31 consecutive important innings, also fourth all-time longest streak. On the face of it, it would appear that he had a very stable career in terms of important innings, with a very small average differential – as David Gower noted, “He has the ability to produce something close to his best every time he plays”. However, like Richards, Gooch’s Test career had two very distinct phases, but in terms of performance in regular innings – or should I say, in innings when he was presented with a lead to build on. I’ll discuss this later when we review Gower’s performance. It’s surprising to think that Gooch debuted before David Steele, who had both averages sitting above 66 after his 106 against West Indies in 1976 – considering that at that point he had played seven Test innings against attacks featuring Lillee, Thomson and Walker and Roberts, Holder and Daniel and fashioned four fifties and a hundred, it was an incredible start. Despite the fact that he had also demonstrated dominance over spinners earlier that year with an innings of 84 from a total of 138 all out, it was downhill after that with his next nine Test innings bringing him an average of just 22. Dilip Vengsarkar enjoyed an 18-month purple patch where he averaged over 100 in important innings.
| Player | ICCrate | iAvg | i100/i50 | rAvg | 100/50 | AvDiff | %iDiff |
| JM Brearley | 496 | 24.12 | 0/7 | 20.43 | 0/2 | +3.69 | +3.5% |
| HA Gomes | 773 | 41.59 | 7/8 | 32.39 | 2/5 | +9.20 | +4.4% |
| P Willey | 512 | 26.45 | 2/4 | 35.80 | 0/1 | -9.35 | -2.9% |
| Javed Miandad | 885 | 55.94 | 21/32 | 43.79 | 2/11 | +12.16 | +5.8% |
| Mudassar Nazar | 668 | 37.96 | 7/13 | 38.52 | 3/4 | -0.56 | +1.6% |
Larry Gomes‘ conversion rate in important innings reflects John Thicknesse’s opinion of him as ‘an efficient batsman in times of strife’. ‘The greatest batsman Pakistan has ever produced’, Javed Miandad is in rarefied company with his important average of over 55, and when he retired was third all-time in important hundreds behind only Bradman and Gavaskar. Mudassar Nazar‘s first Test century took him nine minutes short of ten hours to accumulate, so clearly he was the unflappable sort – his very low average differential confirms that.
| Player | ICCrate | iAvg | i100/i50 | rAvg | 100/50 | AvDiff | %iDiff |
| DW Randall | 629 | 34.09 | 6/7 | 32.80 | 1/5 | +1.29 | +1.6% |
| Haroon Rashid | 606 | 39.33 | 3/4 | 24.82 | 0/1 | +14.52 | +10.9% |
| DW Hookes | 499 | 29.33 | 0/7 | 67.60 | 1/1 | -38.27 | -8.8% |
| IT Botham | 811 | 34.12 | 12/17 | 31.79 | 2/5 | +2.33 | +2.1% |
| KJ Hughes | 828 | 37.30 | 5/16 | 38.46 | 4/6 | -1.16 | -1.3% |
I vividly recall Derek Randall‘s fielding exploits from the late ’70s and early ’80s, one in particular being the diving catch at the SCG in 1979 to dismiss Andy Roberts, but with the bat he wasn’t too shabby either, with a healthy conversion rate in important innings. As noted by Gideon Haigh in Cricket War, while appearing in the WSC Tests Haroon Rashid ‘proved a revelation with his virile, fearless stroke play. One of Pakistan’s most underrated batsmen, he lost nothing by comparison with Viv Richards when the pair made centuries at Rockhampton, in firepower or physique.’ High praise indeed. As he himself admitted, the late David Hookes did not have an exemplary batting record in Tests, his one century coming against a fledgling Sri Lankan side already under the cosh. However his numbers are somewhat skewed by only having batted in seven innings with a lead, which includes that not out century. Though Ian Botham‘s most famous innings came with his side very much in the hole, Beefy’s performances aren’t especially impacted by the situation, which is probably the point. However, as many cricket fans of a certain age are aware, Botham’s career tailed off somewhat from his legendary beginning to being merely good. Botham’s Average differential was +12.58 after his 114 against India in Mumbai, his 35th Test innings, and was still as high as +6.61 following the Edgbaston match-winning 118 in 1981. Kim Hughes shows up as having a slightly negative differential over his whole career, but he had enjoyed a highly positive rating (+7.06) after his famous 100 out of 198 to open the 1981 Boxing Day Test against West Indies. He was to score just two more centuries in 45 Test innings after that.
| Player | ICCrate | iAvg | i100/i50 | rAvg | 100/50 | AvDiff | %iDiff |
| MW Gatting | 730 | 35.88 | 7/18 | 35.74 | 3/3 | +0.14 | -1.0% |
| Mohsin Khan | 770 | 40.87 | 6/6 | 28.58 | 1/3 | +12.29 | +6.9% |
| GM Wood | 677 | 36.79 | 9/12 | 19.55 | 0/1 | +19.55 | +11.5% |
| JG Wright | 702 | 40.44 | 10/21 | 28.94 | 2/2 | +11.50 | +6.2% |
| DL Haynes | 785 | 44.91 | 15/25 | 36.95 | 3/14 | +7.96 | +5.1% |
Mike Gatting‘s differential was as high as +5.27 (41.02/35.75) after 111 Test innings, though on the whole his performance is very consistent. Cricinfo’s profile makes a big deal about how handsome Mohsin Khan is, then hilariously doesn’t include a photo of him – I guess we just have to take their word for it. In any case, his conversion rate in important innings was fairly handsome, too. Initially a fill-in for Packer defections, Graeme Wood played well in his important innings with all nine centuries and all but one fifty being so categorised. When John Wright lost the toss as New Zealand captain he would sprint off the pitch and straight to the bathroom, but he appears to have shown few nerves when his batting was required. Desmond Haynes was of course Greenidge’s partner in dominance, as discussed earlier – despite being somewhat overshadowed by his illustrious compatriot his important numbers stand comparison, both having scored exactly the same number of important centuries.
| Player | ICCrate | iAvg | i100/i50 | rAvg | 100/50 | AvDiff | %iDiff |
| DI Gower | 822 | 47.34 | 17/34 | 33.34 | 1/5 | +14.00 | +6.4% |
| BA Edgar | 721 | 35.82 | 3/10 | 18.21 | 0/2 | +17.21 | +14.7% |
| Kapil Dev | 598 | 30.86 | 5/22 | 31.63 | 3/5 | -0.77 | +0.2% |
| AR Border | 877 | 48.23 | 21/36 | 56.38 | 6/27 | -8.15 | -2.4% |
| AMJ Hilditch | 471 | 38.73 | 2/6 | 15.25 | 0/0 | +18.46 | +6.1% |
Bruce Edgar‘s %iDiff, i.e. the difference in percentage of important runs as compared to percentage of important innings, is the most positive since Stan McCabe. Jeff Thomson once informed Edgar that ‘he’d never die of a stroke’, just prior to the opener compiling 161 in 500 minutes with nine rain breaks at Auckland. Such focus enabled him to compile a very large average differential. For his first 80 Test innings Kapil Dev‘s important average trailed his regular average by more than ten runs, so clearly the next 100 or so innings were significantly different.
Why isn’t Border rated higher?
Allan Border equaled Javed Miandad as third all-time in important tons, and had a significantly better conversion rate in important innings. Averaging at least 48 in any situation is obviously an achievement, but I expected Border to fare better using this measure, which ignores the match result – why doesn’t he? It’s basically because we’re looking at his whole career. If we restrict to the decade of the ’80s, which would constitute a complete career for most, Border’s numbers were as follows:-
Important: 5152 runs, 112 inns, 20 n/o, Avg 57.24, 17 100s, 21 50s
Regular: 1632 runs, 38 inns, 7 n/o, Avg 52.65, 3 100s, 11 50s
AvDiff: +4.59
Those numbers in important innings compare favourably with the complete careers of, for example, Matthew Hayden, Gordon Greenidge, Hashim Amla, Colin Cowdrey and Clive Lloyd. And all that while carrying the hopes of a nation for much of his career as player and captain. When I was researching for Masterly Batting, one thing I looked at was the talent percentage which batsmen represented in their line-up, based on the ICC player ratings. There were times when Border represented 30% of the rated batting talent of his team – this has only been exceeded since then by Brian Lara.
Gooch vs. Gower
It’s always interesting to compare David Gower with his ‘nemesis’ Graham Gooch, each of them engendering either adoration or aversion depending on what kind of batting beauty the beholder prefers. Splitting each player’s Test career into two halves is revealing – Gower’s performance throughout is more consistent (he is one of only 20 players whose Test average never dropped below 40), whereas a glance at Gooch’s splits shows that in the second half of his Test career he clearly cultivated the ability to pile on when England already had a lead, something he had more trouble with in the early part of his career.
Gooch
| Period | iAvg | i100/i50 | rAvg | r100/r50 |
| 1st half | 41.05 | 7/19 | 22.89 | 0/2 |
| 2nd half | 43.93 | 9/19 | 58.91 | 4/6 |
Gower
| Period | iAvg | i100/i50 | rAvg | r100/r50 |
| 1st half | 50.29 | 9/17 | 32.17 | 0/4 |
| 2nd half | 44.58 | 8/17 | 34.83 | 1/1 |
Gooch’s average in regular innings increased from 22.89 in the first half of his career to a whopping 58.91.
| Player | ICCrate | iAvg | i100/i50 | rAvg | 100/50 | AvDiff | %iDiff |
| JF Reid | 746 | 55.27 | 4/2 | 38.33 | 2/0 | +16.93 | +11.0 % |
| Yashpal Sharma | 576 | 36.43 | 1/9 | 23.45 | 1/0 | +12.98 | +5.9% |
| BM Laird | 655 | 35.18 | 0/10 | 36.00 | 0/1 | -0.82 | +1.1% |
| CJ Tavare | 646 | 29.66 | 1/8 | 39.25 | 1/4 | -9.59 | -5.5% |
| RJ Shastri | 608 | 34.87 | 10/8 | 39.80 | 1/4 | -4.93 | -1.8% |
It’s fair to say that a number of players benefitted from WSC defections, and though for example Border was in any case a legend in the making, most of course were not. Bruce Laird made three centuries while playing in WSC Super-Tests, a total exceeded only by Greg Chappell and Viv Richards, but was unable to convert any of his eleven fifties in Test cricket. After 40 Test innings Chris Tavare‘s average differential was -21.31, but three important scores over 50, one a century, in four innings saw him retire with an average differential of less than ten. While not great, it was certainly a lot better than it might have been. Ravi Shastri was not able to enjoy coming in to bat with a lead until he had played 34 Test innings. Though he has a negative differential, his conversion rate in important innings is exceptional. Shastri endured the third longest streak of consecutive important innings with 32, behind only Nari Contractor (36) and Mushtaq Mohammad (33).
| Player | ICCrate | iAvg | i100/i50 | rAvg | 100/50 | AvDiff | %iDiff |
| PJL Dujon | 703 | 33.79 | 4/12 | 28.74 | 1/4 | +5.05 | +4.5% |
| RL Dias | 627 | 35.69 | 3/5 | 50.00 | 0/3 | -14.31 | 0.0% |
| A Ranatunga | 687 | 37.07 | 3/29 | 31.46 | 1/9 | +5.62 | 0.0% |
| MD Crowe | 776 | 48.06 | 16/15 | 34.58 | 1/3 | +13.48 | +5.4% |
| Saleem Malik | 741 | 43.14 | 8/21 | 46.88 | 7/8 | -3.74 | -0.9% |
Jeff Dujon never played in a losing Test series, and playing in one of the greatest ever Test teams ensured that only 60% of his Test innings were played without a healthy lead. Playing for newly admitted Sri Lanka, naturally Roy Dias found himself often called into action when his team was behind – more than 80% of his innings were played with his team behind or level. Although Arjuna Ranatunga had a low conversion rate he did score a lot of fifties in important innings. I admit Martin Crowe is a favourite of mine and I’m delighted to see him so well favoured by this measure; his conversion rate in important innings is exemplary. Although he averaged over 43 no matter the situation, Saleem Malik‘s conversion rate in important innings is significantly inferior to that when his team enjoyed a lead.
| Player | ICCrate | iAvg | i100/i50 | rAvg | 100/50 | AvDiff | %iDiff |
| AJ Lamb | 672 | 34.23 | 9/14 | 41.29 | 5/4 | -7.06 | -2.9% |
| G Fowler | 767 | 35.88 | 3/7 | 31.80 | 0/1 | +4.08 | +1.3% |
| GM Ritchie | 564 | 38.47 | 3/5 | 27.29 | 0/2 | +11.18 | +3.8% |
| KC Wessels | 754 | 41.89 | 6/11 | 37.57 | 0/4 | +4.32 | +2.2% |
| AL Logie | 656 | 34.83 | 0/12 | 40.08 | 2/4 | -5.25 | -4.0% |
Although crafting some centuries in difficult circumstances in his time, notably against the West Indies in 1984, Alan Lamb never enjoyed a positive average differential throughout his Test career. Graham ‘Foxy’ Fowler has a nice positive differential, all of his three centuries and all but one of his fifties coming in important innings. Kepler Wessels’ performances for Australia were unsurprisingly superior than for South Africa, however his average differential was significantly higher for Australia (+14.59) than for South Africa (-16.74), though all of his tons for both nations were made in important innings.
| Player | ICCrate | iAvg | i100/i50 | rAvg | 100/50 | AvDiff | %iDiff |
| Qasim Umar | 637 | 44.00 | 3/4 | 16.55 | 0/1 | +27.45 | +13.5 |
| Shoaib Mmd | 767 | 41.54 | 5/9 | 55.86 | 2/4 | -14.31 | -3.6% |
| NS Sidhu | 683 | 42.45 | 8/12 | 42.67 | 1/3 | -0.22 | +0.4% |
| RB Richardson | 876 | 48.89 | 12/17 | 37.54 | 4/10 | +11.35 | +7.0% |
| GRJ Matthews | 505 | 39.20 | 3/10 | 47.70 | 1/2 | -8.50 | -1.3% |
Qasim Umar had a huge average differential, with all three of his hundreds made in important innings. He did however have seven of 32 important innings of over 50, as opposed to just one of eleven otherwise. Perhaps more than anyone the big-hitting Navjot Sidhu certainly had a career of two halves, which clearly evened themselves out to that final neutral differential of -0.22 – his average differential after 40 innings (he played 78 in all) was -33. Sir Richie Richardson has a very good average differential and a better conversion rate in important innings.
| Player | ICCrate | iAvg | i100/i50 | rAvg | 100/50 | AvDiff | %iDiff |
| DM Jones | 694 | 51.02 | 8/9 | 39.58 | 3/5 | +11.44 | +5.8% |
| BC Broad | 652 | 42.06 | 5/6 | 28.88 | 1/0 | +13.18 | +6.6% |
| PA de Silva | 794 | 44.39 | 18/18 | 37.54 | 2/4 | +6.5 | +2.3% |
| DC Boon | 775 | 43.08 | 15/26 | 48.35 | 6/6 | -5.27 | 0.0% |
| RT Robinson | 710 | 38.89 | 4/6 | 27.00 | 0/0 | +11.86 | +6.6% |
Dean Jones was a popular player and with good reason, as his important average of 51.02 shows and with a great conversion rate too. One gets the impression Matthew Engel wasn’t impressed with Chris Broad‘s batting, pointing out that when Broad emulated Hobbs and Hammond with centuries in three consecutive Ashes Tests in 1986-87 that it was against poor opposition. But surely an attack featuring Merv Hughes, Geoff Lawson, Bruce Reid and Craig McDermott bears comparison with Whitty, Cotter and Hordern (for Hobbs) and Grimmett, Ironmonger and Blackie (for Hammond)? When Hammond scored 251 at Sydney during his run of three Ashes centuries, Otto Nothling (who?) bowled 42 overs. Excellent to see such an exuberant batsman as Aravinda de Silva with such good figures in important innings, as well as an excellent conversion rate. As a Durham man I am required to laud the achievements of David Boon, but regardless he did average over 43 regardless of the situation and scored exactly the same percentage of important runs as he had important innings.
| Player | ICCrate | iAvg | i100/i50 | rAvg | 100/50 | AvDiff | %iDiff |
| M Prabhakar | 459 | 33.49 | 1/8 | 30.08 | 0/1 | +3.40 | +1.5% |
| M Azharuddin | 747 | 46.38 | 18/12 | 42.07 | 4/9 | +4.31 | +2.2% |
| AP Gurusinha | 557 | 40.33 | 7/6 | 28.50 | 0/2 | +11.83 | +5.4% |
| GR Marsh | 571 | 35.67 | 4/11 | 27.46 | 0/4 | +8.21 | +7.3% |
| SR Waugh | 895 | 55.09 | 21/34 | 45.59 | 11/16 | +9.51 | +4.9% |
While his overall conversion rate is exceptional, Mohammad Azharuddin has an astonishing conversion rate in important innings. The phrase ‘ploughing a lone furrow’ comes to mind when thinking of Arjuna Gurusinha, who famously scored 52* from a Sri Lanka total of 82 all out; 88% of his runs were made in important innings. Steve Waugh‘s Australia teams were irresistible – from the beginning of the 3-0 shellacking of South Africa in 2001/02 to the end of the following winter’s Ashes, Waugh had only to bat once without a lead in 19 innings . Even still he has a very high average differential, despite having a differential of less than -16 as late as summer 1997, 12 years after his Test debut.
| Player | ICCrate | iAvg | i100/i50 | rAvg | 100/50 | AvDiff | %iDiff |
| Ijaz Ahmed | 687 | 39.30 | 11/7 | 25.04 | 1/5 | +14.26 | +6.7% |
| AH Jones | 665 | 45.64 | 6/10 | 38.69 | 1/1 | +6.95 | +5.8% |
| SV Manjrekar | 647 | 39.45 | 4/8 | 27.91 | 0/1 | +17.17 | +6.7% |
| CL Hooper | 723 | 33.72 | 8/17 | 47.27 | 5/10 | -13.55 | -4.7% |
| MJ Greatbatch | 654 | 31.51 | 3/9 | 27.60 | 0/1 | +3.91 | +2.1% |
These five batsmen are rated pretty closely by ICC, with Carl Hooper apparently the pick of them (I’m sure Jones would be the choice of our site owner, James Nixon). All but one of Ijaz Ahmed‘s tons were made in important circumstances and with a phenomenal conversion rate in those innings. Playing in a Test side which only won six of 39 Tests in which he appeared, Andrew Jones played well considering. According to Mike Selvey, ‘all too often [Hooper] failed to deliver.’ That appears to be supported by his average differential; in the 25% of his innings when West Indies already held a lead when he came in, he scored more than 30% of his runs. Mark Greatbatch‘s differential was as high as +16 two-thirds of the way through his Test career (first 46 Tests), but he would reach fifty only once more after that.
| Player | ICCrate | iAvg | i100/i50 | rAvg | 100/50 | AvDiff | %iDiff |
| KLT Arthurton | 511 | 37.30 | 2/5 | 22.06 | 0/3 | +15.24 | +9.6% |
| RA Smith | 809 | 44.76 | 7/23 | 39.71 | 2/5 | +5.05 | +3.5% |
| MA Taylor | 773 | 47.79 | 14/29 | 34.54 | 5/11 | +13.25 | +6.6% |
| MA Atherton | 775 | 38.47 | 15/34 | 35.54 | 1/12 | +2.94 | +2.0% |
| SR Tendulkar | 898 | 57.25 | 42*/50 | 47.94 | 9/18 | +12.58 | +4.2% |
Though Keith Arthurton made eight Test ducks in 33 matches, only three of them came in important innings. Robin Smith‘s average against West Indies was better than any of his England contemporaries, and more than halfway into his Test career both situational averages were over 50. An average of almost 48 in important innings demonstrated the strength of Mark Taylor‘s leadership. While his situational averages are fairly close, all but one of Michael Atherton‘s tons were in important innings and he was just one short of 50 important scores over fifty.
Sachin Tendulkar
Where to begin? Sachin Tendulkar‘s total of 92 important scores over fifty eclipsed Gavaskar’s previous high of 70, his total of 42 important tons exceeded the previous highest of 38, again from countryman Gavaskar, and all this with a very good conversion rate. His average differential is very high at +12.58, and his important average of 57.25 is the highest since Ken Barrington of those with significant Tests under their belt; his important average was above 60 over more than 50 Tests.
| Player | ICCrate | iAvg | i100/i50 | rAvg | 100/50 | AvDiff | %iDiff |
| CL Cairns | 699 | 32.32 | 1/20 | 36.61 | 4/2 | -4.28 | -4.0 |
| HP Tillakaratne | 707 | 43.76 | 9/16 | 38.04 | 2/4 | +5.72 | +4.1% |
| SA Thomson | 545 | 27.92 | 1/3 | 58.00 | 0/2 | -30.08 | -7.5% |
| NA Hussain | 768 | 40.55 | 12/28 | 26.51 | 2/5 | +14.04 | +7.7% |
| AJ Stewart | 779 | 39.60 | 12/37 | 37.69 | 3/8 | +1.91 | +2.1% |
At the end of 1996, Hashan Tillakaratne‘s important average was 40 as opposed to 51 otherwise (iDiff of -11); by the end of 2001 he had increased his important average to almost 48. Nasser Hussain‘s batting average only exceeded 40 on one occasion, following his 1997 Ashes innings of 207 in his 18th Test; his important average, meanwhile, was over 40 for 25 Tests and was still there at the end of his career almost 80 Tests after that Ashes double century. After his two centuries at Bridgetown in 1993-94, Alec Stewart‘s average differential was +14.31; by the time he fell to consecutive ducks in the 1998/99 Ashes it had fallen all the way to -2, but 21 important fifties after that restored the balance – Stewart, like his countryman Michael Atherton, was just one short of 50 important scores over fifty.
| Player | ICCrate | iAvg | i100/i50 | rAvg | 100/50 | AvDiff | %iDiff |
| MS Atapattu | 670 | 42.73 | 13/15 | 29.33 | 3/2 | +13.39 | +6.8% |
| Saeed Anwar | 824 | 45.28 | 7/20 | 46.21 | 4/5 | -0.93 | -1.0% |
| BC Lara | 911 | 56.56 | 31/40 | 41.21 | 3/8 | +15.35 | +3.9% |
| ME Waugh | 788 | 44.65 | 13/30 | 38.49 | 7/17 | +6.15 | +4.9% |
| ST Jayasuriya | 770 | 41.62 | 10/25 | 34.71 | 4/6 | +6.91 | +3.5% |
Look up ‘mercurial’ in the dictionary and there’s probably a photo of Marvan Atapattu; it seemed throughout his career he’d either fail or score a double century, the latter being something at which only Bradman, Hammond and Lara had ever been better by the time Atapattu retired. A very level performance was achieved by Saeed Anwar regardless of the situation, though his conversion rate is not as good in important innings. When Mark Waugh scored 139* in his seventh Test his important average was 78.67, but after seven more Tests and following four successive ducks it had plummeted to 37.81. Eleven important hundreds after that restored the balance somewhat. After his 86th Test Sanath Jayasuriya‘s average differential was +11.38. Despite owning some massive Test scores his conversion rate is not great, though if you consider him a batting all-rounder, which almost 100 Test wickets at six runs lower than his batting average suggests you should, he looks pretty good. These five are a group the highest rated of those listed here.
Brian Lara
My personal favourite, Brian Lara has a very high average differential and, as might be expected, a very healthy important average. His total of 31 important centuries is behind only Tendulkar and Gavaskar, and his total of 71 important scores over fifty is second only to Tendulkar. Of course, Lara was not often given a lead to work with, coming in to bat in those circumstances less than 20% of the time – in a sequence where he had to bat in 21 consecutive important situations Lara averaged 68.35 with four tons, two of them doubles. Another sequence of 17 consecutive important innings included his performances of 213 and 153* against Australia in 1998/99. As was mentioned when discussing Border, there was a massive talent differential for some time as West Indies declined while Lara was still at the top – you have to go back to George Headley to find a higher talent percentage than Lara’s 31%.
| Player | ICCrate | iAvg | i100/i50 | rAvg | 100/50 | AvDiff | %iDiff |
| GA Hick | 731 | 30.75 | 4/16 | 33.33 | 2/2 | -2.58 | -0.8% |
| MR Ramprakash | 616 | 29.64 | 2/11 | 19.06 | 0/1 | +10.58 | +4.6% |
| JC Adams | 813 | 35.06 | 3/9 | 62.17 | 3/5 | -27.11 | -11.4% |
| HJ Cronje | 733 | 36.59 | 4/12 | 38.73 | 2/11 | -2.14 | -0.1% |
| AC Hudson | 672 | 38.00 | 3/9 | 25.63 | 1/4 | +12.37 | +8.0% |
Neither Graeme Hick nor Mark Ramprakash were able to shine in the Test arena in the same way they did at County level. Although Hick’s batting average is four runs higher than that of Ramprakash, they both have almost the same important average, though neither could manage better than 30.75 in those circumstances. Ramps may have had it a little tougher, facing an important innings scenario in more than 82% of his innings as opposed to 77% for Hick – in one stretch Ramps had to face 25 consecutive innings without a lead, whereas Hick’s longest sequence was 12. Martin Chandler and Gareth Bland have looked at the ups and downs of each player in detail on Cricketweb. From his third Test until his last, Jimmy Adams‘ average outside important innings never dropped below 80 so it’s not surprising his average differential is highly negative – after 15 Tests it was a massive -74! Though he averaged just 33 in Tests, most of Andrew Hudson‘s big innings were made without a lead so he enjoys a highly positive average differential.
| Player | ICCrate | iAvg | i100/i50 | rAvg | 100/50 | AvDiff | %iDiff |
| PN Kirsten | 510 | 39.08 | 1/3 | 22.43 | 0/1 | +16.65 | +7.0% |
| SC Ganguly | 713 | 40.95 | 11/19 | 43.43 | 5/16 | -2.48 | -1.6% |
| Aamer Sohail | 691 | 37.19 | 5/9 | 30.27 | 0/4 | +6.92 | +4.1% |
| Inzamam-ul-Haq | 870 | 50.01 | 19/38 | 50.69 | 6/8 | -0.68 | +2.3% |
| A Flower | 895 | 52.08 | 11/24 | 47.10 | 1/3 | +4.98 | +1.8% |
After 30 Tests Sourav Ganguly‘s average differential was in double figures, though a sequence of nine important innings where he averaged 18 dropped that to almost -4, and by the time he played his 96th Test it was -8.5 – so a final differential of -2.48 is a significant increase. In his final 17 Tests, Ganguly averaged 53.68 in 20 important innings with two tons and seven scores over 50, as opposed to 11 innings at 32.40 with two scores over 50 otherwise. Inzamam averaged over 50 regardless of the situation, finding himself in the company of Hobbs, Hammond, Bradman, Walcott, Weekes, Sobers, Barrington and Pollock. He had a slow start though – after 18 Tests his average differential was -44! His 57 scores of fifty or more put him fifth all time at that stage. A monumental 90.2% of all Andy Flower‘s Test runs came in important innings; no other player can boast an average of over 50 with so many Tests at such a high percentage.
| Player | ICCrate | iAvg | i100/i50 | rAvg | 100/50 | AvDiff | %iDiff |
| GW Flower | 618 | 29.65 | 5/12 | 29.09 | 1/3 | +0.56 | +0.2% |
| DL Houghton | 630 | 48.27 | 4/3 | 26.13 | 0/1 | +22.16 | +10.7% |
| BM McMillan | 703 | 35.38 | 1/11 | 49.00 | 2/2 | -13.62 | +0.7% |
| JN Rhodes | 586 | 42.45 | 2/13 | 24.93 | 1/4 | +17.32 | +8.4% |
| DR Martyn | 848 | 47.00 | 7/11 | 45.60 | 6/12 | +1.40 | +1.5% |
Dave Houghton has a massive average differential, with all four of his Test hundreds made when his team did not hold a lead. When he made 266 against Sri Lanka he came in at 5/2, with Andy Flower being the next highest scorer with 50. Damien Martyn‘s cricinfo bio states that his hundreds tended to go unnoticed. In my talent study mentioned earlier, the Australian batting line-up of 2004/05 shows up as the highest rated batting line-up of all-time, and Martyn was a part of that line-up – no surprise then that he was over-shadowed. As we can see from the above, his performance in important innings was almost exactly the same as that when he was handed a lead, so he didn’t necessarily have to stand on the shoulders of giants.
In summary, of these 100 players:-
0 players had an important average over 60 (5 last time)
9 players had an important average over 50 (highest Tendulkar 57.25, 15 last time)
14 players had at least 15 important tons (highest Tendulkar with 42, 5 last time)
45 players had at least 20 important fifties (highest Tendulkar with 92, 29 last time)
2 players had an average differential over 20 (highest Qasim Umar with +27.45, 9 last time)
Naturally the aggregate numbers are higher with these hundred batsmen than the previous hundred, though the numbers reaching average thresholds is significantly reduced.
So that’s the first 300 batsmen now covered; in the following feature we’ll bring the study up to date.


Leave a comment