REVISIONS TO STANDARDISING TEST BATTING AVERAGES
Peter Kettle |
I’m very pleased to say there were some twenty responses to my article about standardising Test batting averages (CW, 29 October), many of which have been valuable in indicating avenues for improvement on the initial exercise.
This material summarises concerns expressed in the Forum posts and, in light of these, outlines revisions made to the approach adopted and resulting changes to the ranking of players.
I have made two sets of revisions: one to reflect my own current thinking, and then I’ve combined these with additional revisions which produces results that I think participants may in general prefer.
Concerns and What’s Been Done
Three main concerns were expressed:
- More clarity needed on the way Dead Runs were identified.
. - A small statistical base applying to a number of players, especially those with materially fewer than 20 innings.
. - A feeling that some players simply didn’t belong in very high company.
Clarity on Dead Runs
- There was some misinterpretation of what I did, being partly my fault for not being clearer, and one view expressed that whether or not “dead runs” should be discounted is a matter of personal opinion and therefore is contentious.
- These matters have been addressed in my consolidated note already posted on the Forum thread.
Small Statistical Base
- In this “too few innings” category are Barry Richards (7 inns), Taslim Arif (10 innings with one of these contributing as much as two-fifths of his total runs), and Stewie Dempster (15 innings) – plus five others having close to 20 innings, which was adopted as the general threshold. These exceptions were based on high calibre Test appearances cut short by illness, injury, or political sanctions, or interrupted by WWII.
. - Of these eight “exception” players, I have now eliminated Arif, Dempster and CAG Russell (18 innings), whilst still considering Barry Richards, Sid Barnes (19), Kumar Duleepsinhji (19), Vijay Merchant (18) and Alan Melville (19) are worth retaining given their credentials (as reflected, for instance, in Cricinfo player stats and potted biographies). None have Not Out innings exceeding 11%; Richards and Merchant with nil.
. - Barry Richards is perhaps the most controversial of these and I’ve argued his case in my article, touching on his eight innings in “Super Tests” of the Packer era, averaging 79.1 (only one innings under 28 and two centuries), fronting up, as an opener, against Dennis Lillee in 5 innings and Roberts/Holding in one other innings – this coming nearly a decade after his Tests for South Africa. Also of note: his 342 innings for Hampshire (1968-78) yielding an average of 50.5 and his 160 innings for Natal (1964/5-1982/3) at an average of 59.3.
Not Belonging
- Initially, I thought this feeling of participants might have a connection to players with an abnormally high proportion of Not Out innings.
- Adopting a threshold of 17.0 % or 1 in 6 innings (close to the high end for Cricinfo’s all-time leading Test averages for 64 players with an overall figure of 10.5%), I adjusted my batsmen’s raw averages in cases where they exceeded this level.
- Besides Arif (20%) and Dempster (26%) – both already eliminated – this netted Adam Voges (22.6 %), and four others though by small margins in their cases: Phil Sharpe (19.0%), Steve Waugh (17.7%), Shivnarine Chanderpaul (17.5%) and Charlie Davis (17.2%). Rather than project their Not Out innings to a notional conclusion (based on completed innings of the same and higher scores, which can involve complications), I simply reworked their averages assuming only 17.0% of Not Outs. This principally down-pointed Adam Voges.
A late inclusion – Harry Brook
- Brook qualified with 20 innings just two weeks after my cut-off for the initial exercise.
- He has a “clean bill of health”: averaging 62.15 with only 1 Not Out and zero identified Dead Runs; only one large innings against a weak attack, and no very big innings distorting his average.
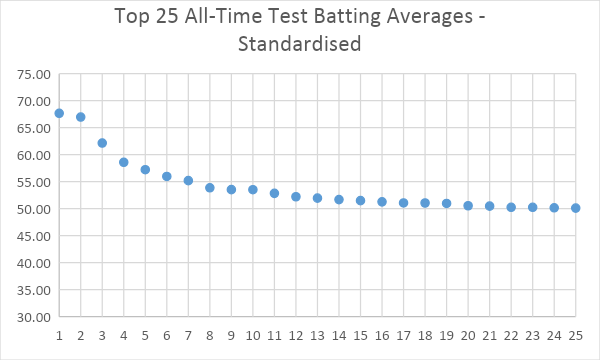
The main table – which follows – has been revised to incorporate these changes. It represents my own current thinking.
| Dominance | Average – | Allow for | STANDARDISED | ||||||
| Career | Raw | Dead Runs | Rating | 2000-23 | Advance in | “EGALITARIAN” | Difference | ||
| Ranking | Span | Average | % | (ex Dead Runs) | Context | Expertise | AVERAGE | with Bradman | |
| 1 | B Richards (SA) | 1970 | 72.57 | nil | 3.19 | 69.42 | -2.5% | 67.65 | 1.0% |
| 2 | D G Bradman (Aus) | 1928-48 | 99.94 | 8.9 | 3.24 | 70.08 | -4.5% | 66.96 | |
| 3 | H Brook (Eng) | 2022-23 | 62.15 | nil | 2.64 | 62.15 | nil | 62.15 | -7.2% |
| 4 | S Smith (Aus) | 2010-23 | 58.94 | 0.6 | 2.37 | 58.59 | nil | 58.59 | -12.5% |
| 5 | D Mitchell (NZ) | 2019-23 | 57.21 | nil | 2.27 | 57.21 | nil | 57.21 | -14.6% |
| 6 | K Sangakkara (SL) | 2000-15 | 57.40 | 2.5 | 2.17 | 55.97 | nil | 55.97 | -16.4% |
| 7 | A Voges (Aus) | 2015-16 | 57.12 | 3.3 | 2.12 | 55.19 | nil | 55.19 | -17.6% |
| 8 | G Pollock (SA) | 1963-70 | 60.97 | 1.3 | 2.16 | 55.77 | -3.4% | 53.87 | -19.5% |
| 9 | K Williamson (NZ) | 2010-23 | 54.89 | 2.5 | 1.99 | 53.52 | nil | 53.52 | -20.1% |
| 10 | J Kallis (SA) | 1995-2013 | 55.37 | 2.1 | 2.00 | 53.65 | -0.3% | 53.51 | -20.1% |
| 11 | M Labuschagne (Aus) | 2018-23 | 53.80 | 1.8 | 1.94 | 52.83 | nil | 52.83 | -21.1% |
| 12 | S Barnes (Aus) | 1938-48 | 63.05 | 3.1 | 2.10 | 54.98 | -5.0% | 52.21 | -22.0% |
| 13 | S Tendulkar (Ind) | 1989-2013 | 53.78 | 1.0 | 1.89 | 52.19 | -0.5% | 51.95 | -22.4% |
| 14 | Younis Khan (Pak) | 2000-17 | 52.05 | 0.7 | 1.85 | 51.68 | nil | 51.68 | -22.8% |
| 15 | K Barrington (Eng) | 1955-68 | 58.67 | nil | 1.99 | 53.52 | -3.8% | 51.48 | -23.1% |
| 16 | R Dravid (Ind) | 1996-2012 | 52.31 | 0.6 | 1.83 | 51.40 | -0.3% | 51.26 | -23.4% |
| 17 | G Sobers (WI) | 1954-74 | 57.78 | 0.7 | 1.95 | 52.99 | -3.6% | 51.06 | -23.7% |
| 18 | M Yousuf (Pak) | 1998-2010 | 52.29 | 1.3 | 1.81 | 51.13 | -0.2% | 51.05 | -23.8% |
| 19 | R Ponting (Aus) | 1995-2012 | 51.85 | 0.2 | 1.81 | 51.13 | -0.3% | 50.97 | -23.9% |
| 20 | B Lara (WI) | 1990-2006 | 52.88 | 1.0 | 1.79 | 50.87 | -0.6% | 50.54 | -24.5% |
| 21 | E Weekes (WI) | 1948-58 | 58.61 | nil | 1.95 | 52.99 | -4.8% | 50.46 | -24.6% |
| 22 = | J Hobbs (Eng) | 1908-30 | 56.94 | nil | 2.01 | 53.78 | -6.6% | 50.25 | -25.0% |
| FS Jackson (Eng) | 1893-1905 | 48.79 | nil | 2.02 | 53.92 | -6.8% | 50.25 | -25.0% | |
| 24 | M Hussey (Aus) | 2005-13 | 51.52 | 2.6 | 1.74 | 50.16 | nil | 50.16 | -25.1% |
| 25 | Allan Steel (Eng) | 1880-88 | 35.29 | nil | 2.04 | 54.18 | -7.5% | 50.11 | -25.2% |
| 26 | D Conway (NZ) | 2021-23 | 50.10 | nil | 1.73 | 50.10 | nil | 50.10 | -25.2% |
| 27 | M Hayden (Aus) | 1994-2008 | 50.73 | 1.2 | 1.72 | 49.94 | -0.4% | 49.72 | -25.7% |
| 28 | J Root (Eng) | 2012-23 | 50.16 | 0.9 | 1.70 | 49.71 | nil | 49.71 | -25.8% |
| 29 = | G Chappell (Aus) | 1970-84 | 53.86 | 1.3 | 1.82 | 51.27 | -3.1% | 49.66 | -25.8% |
| V Kambli (Ind) | 1993-95 | 54.20 | 1.8 | 1.74 | 50.21 | -1.1% | 49.66 | -25.8% | |
| 31 | AB de Villiers (SA) | 2004-18 | 50.66 | 2.5 | 1.68 | 49.39 | nil | 49.39 | -26.2% |
| 32 | V Sehwag (Ind) | 2001-13 | 49.34 | nil | 1.67 | 49.34 | nil | 49.34 | -26.3% |
| 33 | J Miandad (Pak) | 1976-93 | 52.57 | 0.6 | 1.76 | 50.47 | -2.4% | 49.28 | -26.4% |
| 34 | A Flower (Zim) | 1992-2002 | 51.54 | nil | 1.70 | 49.68 | -0.8% | 49.27 | -26.4% |
| 35 | S Chanderpaul (WI) | 1994-2015 | 50.93 | 0.8 | 1.68 | 49.41 | -0.3% | 49.26 | -26.4% |
| 36 | G Headley (WI) | 1930-39 | 66.72 | nil | 1.89 | 52.19 | -6.0% | 49.07 | -26.7% |
| 37 | B Azam (Pak) | 2016-23 | 48.63 | nil | 1.62 | 48.63 | nil | 48.63 | -27.4% |
| 38 | M Jayawardene (SL) | 1997-2014 | 49.84 | 1.5 | 1.62 | 48.62 | -0.2% | 48.53 | -27.5% |
| 39 | M Clarke (Aus) | 2004-15 | 49.10 | 1.3 | 1.61 | 48.47 | nil | 48.47 | -27.6% |
| 40 | T Samaraweera (SL) | 2001-13 | 48.76 | 0.7 | 1.60 | 48.40 | nil | 48.40 | -27.7% |
| 41 | Abid Ali (Pak) | 2019-21 | 49.16 | 1.7 | 1.60 | 48.32 | nil | 48.32 | -27.8% |
| 42 | C Walcott (WI) | 1948-60 | 56.58 | 1.6 | 1.77 | 50.60 | -4.8% | 48.16 | -28.1% |
| 43 | C Davis (WI) | 1968-73 | 52.04 | nil | 1.70 | 49.68 | -3.4% | 48.00 | -28.3% |
| 44 | S Waugh (Aus) | 1985-2004 | 51.06 | 0.5 | 1.61 | 48.48 | -1.2% | 47.90 | -28.5% |
| 45 | S Gavaskar (Ind) | 1971-87 | 51.12 | nil | 1.68 | 49.41 | -3.1% | 47.89 | -28.5% |
| 46 | G Smith (SA) | 2002-14 | 48.25 | 0.9 | 1.56 | 47.83 | nil | 47.83 | -28.6% |
| 47 | V Kohli (Ind) | 2011-23 | 48.72 | 1.9 | 1.56 | 47.79 | nil | 47.79 | -28.6% |
| 48 | Inzamam-ul-Haq (Pak) | 1992-2007 | 49.60 | 0.7 | 1.57 | 47.95 | -0.6% | 47.68 | -28.8% |
| 49 | A Border (Aus) | 1978-94 | 50.56 | 0.3 | 1.62 | 48.62 | -2.5% | 47.42 | -29.2% |
| 50 | A Shafique (Pak) | 2021-23 | 47.23 | nil | 1.52 | 47.23 | nil | 47.23 | -29.5% |
| 51 | U Khawaja (Aus) | 2011-23 | 47.68 | 1.4 | 1.50 | 47.00 | nil | 47.00 | -29.8% |
| 52 | V Richards (WI) | 1974-91 | 50.23 | 0.9 | 1.59 | 48.22 | -2.8% | 46.89 | -30.0% |
| 53 | L Hutton (Eng) | 1937-55 | 56.67 | 1.4 | 1.70 | 49.68 | -5.6% | 46.88 | -30.0% |
| 54 | A Gilchrist (Aus) | 1999-2008 | 47.60 | 1.4 | 1.48 | 46.76 | -0.1% | 46.71 | -30.2% |
| 55 | A Shrewsbury (Eng) | 1882-93 | 35.47 | nil | 1.78 | 50.74 | -8.0% | 46.66 | -30.3% |
| 56 | Misbah-ul-Haq (Pak) | 2001-17 | 46.62 | nil | 1.47 | 46.62 | nil | 46.62 | -30.4% |
| 57 | K Pietersen (Eng) | 2005-14 | 47.28 | 1.7 | 1.46 | 46.47 | nil | 46.47 | -30.6% |
| 58 | D Martyn (Aus) | 1992-2006 | 46.37 | nil | 1.43 | 46.10 | -0.1% | 46.04 | -31.2% |
| 59 | KS Ranjitsinhji (Eng) | 1896-1902 | 44.95 | nil | 1.68 | 49.41 | -7.4% | 45.74 | -31.7% |
| 60 | H Amla (SA) | 2004-19 | 46.64 | 2.0 | 1.40 | 45.71 | nil | 45.71 | -31.7% |
| 61 | T Head (Aus) | 2018-23 | 46.80 | 2.5 | 1.39 | 45.63 | nil | 45.63 | -31.9% |
| 62 | R Sharma (Ind) | 2013-23 | 45.22 | nil | 1.36 | 45.22 | nil | 45.22 | -32.5% |
| 63 = | VVS Laxman (Ind) | 1996-2012 | 45.97 | 0.9 | 1.36 | 45.17 | -0.3% | 45.03 | -32.7% |
| S Katich (Aus) | 2001-10 | 45.03 | nil | 1.35 | 45.03 | nil | 45.03 | -32.8% | |
| 65 | A Cook (Eng) | 2006-18 | 45.35 | 0.9 | 1.34 | 44.95 | nil | 44.95 | -32.9% |
| 66 | WG Grace (Eng) | 1880-93 | 36.54 | nil | 1.65 | 49.01 | -8.3% | 44.94 | -32.9% |
| 67 | M Richardson (NZ) | 2000-04 | 44.77 | nil | 1.33 | 44.77 | nil | 44.77 | -33.1% |
| 68 | G Kirsten (SA) | 1993-2004 | 47.25 | 1.5 | 1.34 | 44.91 | -0.7% | 44.58 | -33.4% |
| 69 | R Taylor (NZ) | 2007-22 | 44.66 | 0.5 | 1.30 | 44.44 | nil | 44.44 | -33.6% |
| 70 | H Sutcliffe (Eng) | 1924-35 | 60.73 | nil | 1.55 | 47.69 | -6.8% | 44.43 | -33.6% |
| 71 | A Mathews (SL) | 2009-23 | 44.93 | 1.4 | 1.29 | 44.30 | nil | 44.30 | -33.8% |
| 72 | D Lehmann (Aus) | 1998-2004 | 44.95 | nil | 1.30 | 44.38 | -0.2% | 44.27 | -33.9% |
| 73 | D Warner (Aus) | 2011-23 | 44.61 | 1.0 | 1.28 | 44.16 | nil | 44.16 | -34.0% |
| 74 | J Langer (Aus) | 1993-2007 | 45.27 | 0.5 | 1.29 | 44.24 | -0.6% | 44.00 | -34.3% |
| 75 | KD Walters (Aus) | 1965-81 | 48.26 | 0.6 | 1.40 | 45.70 | -3.8% | 43.96 | -34.3% |
| 76 | JF Reid (NZ) | 1979-86 | 46.28 | nil | 1.36 | 45.17 | -2.9% | 43.87 | -34.5% |
| 77 | D Jones (Aus) | 1984-92 | 46.65 | nil | 1.33 | 44.77 | -2.2% | 43.77 | -34.6% |
| 78 | C Pujara (Ind) | 2010-23 | 43.60 | nil | 1.24 | 43.60 | nil | 43.60 | -34.9% |
| 79 | G Boycott (Eng) | 1964-82 | 47.72 | nil | 1.37 | 45.30 | -3.8% | 43.59 | -34.9% |
| 80 | CP Mead (Eng) | 1911-28 | 49.37 | nil | 1.50 | 47.03 | -7.5% | 43.50 | -35.0% |
| 81 | R Pant (Ind) | 2018-22 | 43.67 | 0.6 | 1.23 | 43.41 | nil | 43.41 | -35.2% |
| 82 | D Nourse (SA) | 1935-51 | 53.81 | nil | 1.44 | 46.23 | -6.3% | 43.30 | -35.3% |
| 83 | J Trott (Eng) | 2009-15 | 44.08 | 2.2 | 1.20 | 43.11 | nil | 43.11 | -35.6% |
| 84 | C Lloyd (WI) | 1966-85 | 46.67 | 0.5 | 1.32 | 44.64 | -3.6% | 43.04 | -35.7% |
| 85 | M Trescothick (Eng) | 2000-06 | 43.79 | 2.0 | 1.19 | 42.91 | nil | 42.91 | -35.9% |
| 86 | KS Duleepsinhji (Eng) | 1929-31 | 58.52 | nil | 1.43 | 46.10 | -6.9% | 42.89 | -35.9% |
| 87 | C Rogers (Aus) | 2008-15 | 42.87 | nil | 1.19 | 42.87 | nil | 42.87 | -36.0% |
| 88 | W Hammond (Eng) | 1927-47 | 58.45 | 1.8 | 1.42 | 45.97 | -6.8% | 42.84 | -36.0% |
| 89 | G Thorpe (Eng) | 1993-2005 | 44.66 | 0.9 | 1.19 | 42.92 | -0.7% | 42.62 | -36.4% |
| 90 | Saeed Anwar (Pak) | 1990-2001 | 45.52 | nil | 1.20 | 43.05 | -1.1% | 42.59 | -36.4% |
| 91 | A Melville (SA) | 1938-49 | 52.58 | nil | 1.38 | 45.44 | -6.3% | 42.58 | -36.4% |
| 92 | C Bland (SA) | 1961-66 | 49.01 | nil | 1.31 | 44.51 | -4.6% | 42.47 | -36.6% |
| 93 | S Nurse (WI) | 1960-69 | 46.60 | nil | 1.30 | 44.38 | -4.4% | 42.42 | -36.6% |
| 94 | R Kanhai (WI) | 1957-74 | 47.53 | 0.5 | 1.26 | 43.85 | -3.4% | 42.35 | -36.8% |
| 95 | D Amiss (Eng) | 1966-77 | 46.30 | nil | 1.28 | 44.11 | -4.1% | 42.32 | -36.8% |
| 96 = | E Paynter (Eng) | 1931-39 | 59.23 | 2.9 | 1.37 | 45.30 | -6.9% | 42.18 | -37.0% |
| C Gayle (WI) | 2000-14 | 42.18 | nil | 1.13 | 42.18 | nil | 42.18 | -37.0% | |
| 98 | F Worrell (WI) | 1948-63 | 49.48 | 1.2 | 1.31 | 44.51 | -5.4% | 42.12 | -37.1% |
| 99 | M Azharuddin (Ind) | 1985-2000 | 45.03 | 2.1 | 1.18 | 42.79 | -1.7% | 42.05 | -37.2% |
| 100 | D Boon (Aus) | 1984-96 | 43.65 | nil | 1.19 | 42.92 | -2.1% | 42.02 | -37.2% |
| 101 | D Compton (Eng) | 1937-57 | 50.06 | 1.0 | 1.33 | 44.77 | -6.2% | 41.98 | -37.3% |
| 102 | W Lawry (Aus) | 1961-71 | 47.15 | nil | 1.26 | 43.85 | -4.4% | 41.92 | -37.4% |
| 103 | M Goodwin (Zim) | 1998-2000 | 42.84 | nil | 1.14 | 42.26 | -1.0% | 41.82 | -37.5% |
| 104 | Azhar Ali (Pak) | 2010-22 | 42.26 | 1.2 | 1.10 | 41.75 | nil | 41.75 | -37.6% |
| 105 | ER Dexter (Eng) | 1958-68 | 47.89 | nil | 1.25 | 43.71 | -4.5% | 41.73 | -37.7% |
| 106 | G Greenidge (WI) | 1974-91 | 44.72 | 0.4 | 1.20 | 43.05 | -3.1% | 41.72 | -37.7% |
| 107 | I Bell (Eng) | 2004-15 | 42.69 | 2.4 | 1.10 | 41.67 | nil | 41.67 | -37.8% |
| 108 | R Cowper (Aus) | 1964-68 | 46.84 | nil | 1.24 | 43.58 | -4.4% | 41.65 | -37.8% |
| 109 | A Prince (SA) | 2002-11 | 41.64 | nil | 1.09 | 41.64 | nil | 41.64 | -37.8% |
| 110 | M Crowe (NZ) | 1982-95 | 45.36 | 2.2 | 1.16 | 42.52 | -2.2% | 41.60 | -37.9% |
| 111 | R Abel (Eng) | 1888-1902 | 37.20 | nil | 1.39 | 45.57 | -8.8% | 41.58 | -37.9% |
| 112 | D Cullinan (SA) | 1993-2001 | 44.21 | 1.0 | 1.12 | 41.99 | -1.0% | 41.56 | -37.9% |
| 113 | G Gambhir (India) | 2004-16 | 41.95 | 1.0 | 1.09 | 41.53 | nil | 41.53 | -38.0% |
| 114 | R Richardson (WI) | 1983-95 | 44.39 | nil | 1.15 | 42.39 | -2.1% | 41.49 | -38.0% |
| 115 = | W Murdoch (Aus) | 1877-92 | 31.31 | nil | 1.38 | 45.44 | -9.0% | 41.36 | -38.2% |
| S Williams (Zim) | 2013-21 | 41.36 | nil | 1.07 | 41.36 | nil | 41.36 | -38.2% | |
| 117 | D Gower (Eng) | 1978-92 | 44.25 | 0.6 | 1.16 | 42.52 | -2.7% | 41.35 | -38.2% |
| 118 | M Vaughan (Eng) | 1999-2008 | 41.44 | nil | 1.07 | 41.33 | -0.1% | 41.27 | -38.4% |
| 119 | Zaheer Abbas (Pak) | 1969-85 | 44.79 | 0.5 | 1.19 | 42.92 | -3.9% | 41.26 | -38.4% |
| 120 = | R Simpson (Aus) | 1957-78 | 46.81 | nil | 1.21 | 43.18 | -4.5% | 41.23 | -38.4% |
| Shoaib Mohammad (Pak) | 1983-95 | 44.34 | 1.8 | 1.13 | 42.12 | -2.1% | 41.23 | -38.4% | |
| 122 = | S Ganguly (India) | 1996-2008 | 42.17 | 0.4 | 1.07 | 41.33 | -0.4% | 41.16 | -38.5% |
| H Gibbs (SA) | 1996-2008 | 41.95 | 0.6 | 1.07 | 41.33 | -0.4% | 41.16 | -38.5% | |
| 124 | N Harvey (Aus) | 1948-63 | 48.41 | 1.7 | 1.22 | 43.32 | -5.5% | 40.95 | -38.8% |
| 125 | G Turner (NZ) | 1969-83 | 44.64 | nil | 1.16 | 42.52 | -3.8% | 40.89 | -38.9% |
| 126 | A Kallicharran (WI) | 1972-81 | 44.43 | nil | 1.16 | 42.52 | -3.9% | 40.86 | -39.0% |
| 127 | T Latham (NZ) | 2014-23 | 41.53 | 1.9 | 1.03 | 40.74 | nil | 40.74 | -39.2% |
| 128 = | Saleem Malik (Pak) | 1982-99 | 43.69 | 0.7 | 1.08 | 41.46 | -2.0% | 40.62 | -39.3% |
| R Subba Row (Eng) | 1958-61 | 46.85 | nil | 1.17 | 42.65 | -4.8% | 40.62 | -39.3% | |
| 130 | S Dhawan (Ind) | 2013-18 | 40.61 | nil | 1.02 | 40.61 | nil | 40.61 | -39.4% |
| 131 | V Hazare (Ind) | 1946-53 | 47.65 | nil | 1.22 | 43.32 | -6.3% | 40.60 | -39.4% |
| 132 | M Agarwal (Ind) | 2018-22 | 41.33 | 1.9 | 1.01 | 40.54 | nil | 40.54 | -39.4% |
| 133 | R Smith (Eng) | 1988-96 | 43.67 | nil | 1.05 | 41.06 | -1.7% | 40.36 | -39.7% |
| 134 | AH Jones (NZ) | 1987-95 | 44.27 | 1.9 | 1.05 | 41.06 | -1.9% | 40.30 | -39.8% |
| 135 | Aravinda de Silva (SL) | 1984-2002 | 42.97 | 0.5 | 1.04 | 40.93 | -1.7% | 40.25 | -39.9% |
| 136 | A Faulkner (SA) | 1906-24 | 40.79 | nil | 1.26 | 43.85 | -8.3% | 40.21 | -40.0% |
| 137 | M Taylor (Aus) | 1989-99 | 43.49 | nil | 1.03 | 40.80 | -1.5% | 40.20 | -40.0% |
| 138 | E Barlow (SA) | 1961-70 | 45.74 | nil | 1.13 | 42.12 | -4.6% | 40.19 | -40.0% |
| 139 | M Slater (Aus) | 1993-2001 | 42.83 | 0.3 | 1.01 | 40.53 | -1.1% | 40.10 | -40.1% |
| 140 | E Tyldesley (Eng) | 1921-29 | 55.00 | nil | 1.23 | 43.45 | -7.8% | 40.05 | -40.2% |
| 141 | PBH May (Eng) | 1951-61 | 46.77 | 0.8 | 1.14 | 42.26 | -5.6% | 39.89 | -40.4% |
| 142 | L Rowe (WI) | 1972-80 | 43.55 | nil | 1.09 | 41.59 | -4.1% | 39.88 | -40.4% |
| 143 | D Haynes (WI) | 1978-94 | 42.29 | nil | 1.02 | 40.67 | -2.7% | 39.58 | -40.9% |
| 144 = | M Amarnath (India) | 1969-88 | 42.50 | nil | 1.05 | 41.06 | -3.7% | 39.54 | -40.9% |
| J Robertson (Eng) | 1947-52 | 46.37 | nil | 1.14 | 42.26 | -6.4% | 39.54 | -40.9% | |
| 146 | P McDonnell (Aus) | 1880-88 | 29.93 | nil | 1.24 | 43.58 | -9.3% | 39.51 | -41.0% |
| 147 | D Vengsarkar (India) | 1976-92 | 42.13 | nil | 1.02 | 40.67 | -3.0% | 39.44 | -41.1% |
| 148 | N O’Neill (Aus) | 1958-65 | 45.55 | nil | 1.08 | 41.46 | -4.9% | 39.42 | -41.1% |
| 149 | A Rae (WI) | 1948-53 | 46.18 | nil | 1.13 | 42.12 | -6.4% | 39.41 | -41.1% |
| 150 = | H Tillakaratne (SL) | 1989-2004 | 41.70 | nil | 0.95 | 39.74 | -1.0% | 39.34 | -41.2% |
| G Gooch (Eng) | 1975-95 | 42.58 | 0.9 | 1.00 | 40.40 | -2.6% | 39.34 | -41.2% | |
| 152 | A Morris (Aus) | 1946-55 | 46.48 | 0.8 | 1.12 | 41.99 | -6.5% | 39.28 | -41.3% |
| 153 | C Hunte (WI) | 1958-67 | 45.06 | nil | 1.05 | 41.06 | -4.9% | 39.05 | -41.7% |
| 154 | I Redpath (Aus) | 1964-76 | 43.45 | 0.6 | 1.03 | 40.80 | -4.5% | 38.98 | -41.8% |
| 155 = | P Sharpe (Eng) | 1963-69 | 43.67 | nil | 1.03 | 40.80 | -4.5% | 38.96 | -41.8% |
| L Hassett (Aus) | 1938-53 | 46.56 | 1.6 | 1.10 | 41.73 | -6.6% | 38.96 | -41.8% | |
| 157 | C Hill (Aus) | 1896-1912 | 39.21 | nil | 1.16 | 42.52 | -8.7% | 38.83 | -42.0% |
| 158 | R Fredericks (WI) | 1968-77 | 42.49 | nil | 1.01 | 40.53 | -4.4% | 38.77 | -42.1% |
| 159 | T Graveney (Eng) | 1951-69 | 44.38 | nil | 1.04 | 40.93 | -5.3% | 38.76 | -42.1% |
| 160 | J Edrich (Eng) | 1963-76 | 43.54 | 1.4 | 1.01 | 40.53 | -4.6% | 38.69 | -42.2% |
| 161 | I Chappell (Aus) | 1964-80 | 42.42 | 0.7 | 1.00 | 40.40 | -4.4% | 38.61 | -42.3% |
| 162 | V Trumper (Aus) | 1899-1912 | 39.04 | nil | 1.14 | 42.26 | -8.7% | 38.59 | -42.4% |
| 163 | C Cowdrey (Eng) | 1954-75 | 44.06 | 0.3 | 1.01 | 40.53 | -5.0% | 38.52 | -42.5% |
| 164 | Hanif Mohammad (Pak) | 1952-69 | 43.98 | nil | 1.00 | 40.40 | -5.3% | 38.26 | -42.9% |
| 165 | J Ryder (Aus) | 1920-29 | 51.62 | nil | 1.04 | 40.93 | -8.1% | 37.62 | -43.8% |
| 166 | C Macartney (Aus) | 1907-26 | 41.78 | nil | 1.05 | 41.06 | -8.7% | 37.51 | -44.0% |
| 167 | V Merchant (Ind) | 1933-51 | 47.72 | nil | 1.00 | 40.40 | -7.3% | 37.47 | -44.0% |
| 168 | B Mitchell (SA) | 1929-49 | 48.88 | nil | 1.00 | 40.40 | -7.5% | 37.36 | -44.2% |
| 169 | V Ransford (Aus) | 1907-12 | 37.84 | nil | 1.03 | 40.80 | -9.1% | 37.11 | -44.6% |
| 170 | W Bates (Eng) | 1882-87 | 27.33 | nil | 1.04 | 40.93 | -9.9% | 36.86 | -45.0% |
| 171 | G Gunn (Eng) | 1907-30 | 40.00 | nil | 1.00 | 40.40 | -8.9% | 36.82 | -45.0% |
I suspect that some participants may still have a number of reservations over the revised ranking. I’ve considered two possible reasons:
- The Ranking May Over-State Ability: for those with only 20-30 innings
From further analysis, I think this to be unlikely in general:
- Taking the top 14 players of the above table who have at least 50 innings and 10 more selected at random with 50 plus innings (24 players in all), only Bradman, Younis Khan and Pujara didn’t improve on their initial 20 innings when they reached 50 innings. The former were a down a touch on 20 innings (official) averages of 99.4 and 41.2; whilst Pujara dropped from 61 to 49.
- All except five improved their average when moving from 20 to 30 innings, two of whom maintained their average unchanged.
- Each of the 24 players examined had a wide variety of scores in their initial 20 innings, rather than having predominantly low or high scores (though Bradman and Labuschagne were heavily represented with big centuries).
Details for (a) and (b) are given in Table 2 below.
| Averages | |||
| at 20 inns | at 30 inns | at 50 inns | |
| D. Bradman | 99 | 106 | 96 |
| S. Smith | 32 | 35 | 52 |
| K. Sangakkara | 38 | 52 | 48 |
| G. Pollock | 51 | 54 | 61 |
| (41 inns) | |||
| K. Williamson | 31 | 31 | 35 |
| J. Kallis | 24 | 29 | 41 |
| M. Labuschagne | 58 | 62 | 59 |
| S. Tendulkar | 35 | 39 | 54 |
| M. Younis Khan | 41 | 46 | 39 |
| K. Barrington | 46 | 43 | 52 |
| R. Dravid | 48 | 52 | 55 |
| G. Sobers | 31 | 49 | 60 |
| M. Yousuf | 35 | 33 | 43 |
| R. Ponting | 42 | 40 | 44 |
| B. Lara | 47 | 56 | 59 |
| M. Hayden | 26 | 39 | 51 |
| Inzamam-ul-Haq | 33 | 43 | 46 |
| D. Martyn | 40 | 45 | 46 |
| G. Kirsten | 35 | 37 | 36 |
| C. Pujara | 61 | 62 | 49 |
| A. Prince | 37 | 37 | 43 |
| Zaheer Abbas | 34 | 36 | 44 |
| S. Dhawan | 36 | 42 | 44 |
| P. May | 40 | 36 | 45 |
| G. Gooch | 25 | 31 | 35 |
Improvement is, in general, to be expected with increasing experience/learning (barring injury, etc).
As far as this evidence takes us, it suggests that averages for those with around 20-30 innings can generally be taken as representative of ability at that stage of their careers, though there will likely be some individual exceptions.
- Importance of Attaining “Stature”
So I turned to another potential reason for reservations about the revised ranking table – lack of attained stature in the game. I now suspect this is the chief reason.
“Stature” is attained or bestowed by career length (years played), or more usually by a sizeable accumulation of innings, for those with a distinctly healthy average. Forum participants like arguing largely about heavyweights, judging from the Player Comparisons thread.
One could give a graduated weighting for this factor, though no participant explicitly advocated this. Instead, I’ve gone for a cut-off rule. What is to count as a sufficient number of innings is debatable, but I’ve chosen 50 innings as reasonable for post-WW1 players, and 25 innings for previous times to reflect a far lower frequency of Tests and the calibre of who this captures.
Upshot: 32 of the 171 players have less than the specified number of innings – ie 19% of the total. These would all be excluded on this basis and are identified by underlining their names in Table 1.
Only 2 of these 32 are wholly or predominantly pre-WW1 players (15 in total).
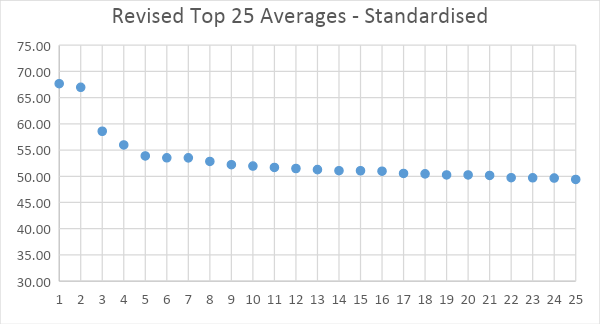
Reflection: 6 of these 32 players include widely recognised Greats of the game: Graeme Pollock, Barry Richards, Sid Barnes, KS Duleepsinhji, Vijay Merchant and George Headley. I presume (without actual knowledge) that all, or most, participants would want to retain them as valid exceptions. If this is so, I’ve shown the resulting 145 players and the top 25 averages in the table and graph below:
| Dominance | Average – | Allow for | STANDARDISED | ||||||
| Career | Raw | Dead Runs | Rating | 2000-23 | Advance in | “EGALITARIAN” | Difference | ||
| Ranking | Span | Average | % | (ex Dead Runs) | Context | Expertise | AVERAGE | with Bradman | |
| 1 | B Richards (SA) | 1970 | 72.57 | nil | 3.19 | 69.42 | -2.5% | 67.65 | 1.0% |
| 2 | D G Bradman (Aus) | 1928-48 | 99.94 | 8.9 | 3.24 | 70.08 | -4.5% | 66.96 | |
| 3 | S Smith (Aus) | 2010-23 | 58.94 | 0.6 | 2.37 | 58.59 | nil | 58.59 | -12.5% |
| 4 | K Sangakkara (SL) | 2000-15 | 57.40 | 2.5 | 2.17 | 55.97 | nil | 55.97 | -16.4% |
| 5 | G Pollock (SA) | 1963-70 | 60.97 | 1.3 | 2.16 | 55.77 | -3.4% | 53.87 | -19.5% |
| 6 | K Williamson (NZ) | 2010-23 | 54.89 | 2.5 | 1.99 | 53.52 | nil | 53.52 | -20.1% |
| 7 | J Kallis (SA) | 1995-2013 | 55.37 | 2.1 | 2.00 | 53.65 | -0.3% | 53.51 | -20.1% |
| 8 | M Labuschagne (Aus) | 2018-23 | 53.80 | 1.8 | 1.94 | 52.83 | nil | 52.83 | -21.1% |
| 9 | S Barnes (Aus) | 1938-48 | 63.05 | 3.1 | 2.10 | 54.98 | -5.0% | 52.21 | -22.0% |
| 10 | S Tendulkar (Ind) | 1989-2013 | 53.78 | 1.0 | 1.89 | 52.19 | -0.5% | 51.95 | -22.4% |
| 11 | Younis Khan (Pak) | 2000-17 | 52.05 | 0.7 | 1.85 | 51.68 | nil | 51.68 | -22.8% |
| 12 | K Barrington (Eng) | 1955-68 | 58.67 | nil | 1.99 | 53.52 | -3.8% | 51.48 | -23.1% |
| 13 | R Dravid (Ind) | 1996-2012 | 52.31 | 0.6 | 1.83 | 51.40 | -0.3% | 51.26 | -23.4% |
| 14 | G Sobers (WI) | 1954-74 | 57.78 | 0.7 | 1.95 | 52.99 | -3.6% | 51.06 | -23.7% |
| 15 | M Yousuf (Pak) | 1998-2010 | 52.29 | 1.3 | 1.81 | 51.13 | -0.2% | 51.05 | -23.8% |
| 16 | R Ponting (Aus) | 1995-2012 | 51.85 | 0.2 | 1.81 | 51.13 | -0.3% | 50.97 | -23.9% |
| 17 | B Lara (WI) | 1990-2006 | 52.88 | 1.0 | 1.79 | 50.87 | -0.6% | 50.54 | -24.5% |
| 18 | E Weekes (WI) | 1948-58 | 58.61 | nil | 1.95 | 52.99 | -4.8% | 50.46 | -24.6% |
| 19= | J Hobbs (Eng) | 1908-30 | 56.94 | nil | 2.01 | 53.78 | -6.6% | 50.25 | -25.0% |
| FS Jackson (Eng) | 1893-1905 | 48.79 | nil | 2.02 | 53.92 | -6.8% | 50.25 | -25.0% | |
| 21 | M Hussey (Aus) | 2005-13 | 51.52 | 2.6 | 1.74 | 50.16 | nil | 50.16 | -25.1% |
| 22 | M Hayden (Aus) | 1994-2008 | 50.73 | 1.2 | 1.72 | 49.94 | -0.4% | 49.72 | -25.7% |
| 23 | J Root (Eng) | 2012-23 | 50.16 | 0.9 | 1.70 | 49.71 | nil | 49.71 | -25.8% |
| 24 | G Chappell (Aus) | 1970-84 | 53.86 | 1.3 | 1.82 | 51.27 | -3.1% | 49.66 | -25.8% |
| 25 | AB de Villiers (SA) | 2004-18 | 50.66 | 2.5 | 1.68 | 49.39 | nil | 49.39 | -26.2% |
| 26 | V Sehwag (Ind) | 2001-13 | 49.34 | nil | 1.67 | 49.34 | nil | 49.34 | -26.3% |
| 27 | J Miandad (Pak) | 1976-93 | 52.57 | 0.6 | 1.76 | 50.47 | -2.4% | 49.28 | -26.4% |
| 28 | A Flower (Zim) | 1992-2002 | 51.54 | nil | 1.70 | 49.68 | -0.8% | 49.27 | -26.4% |
| 29 | S Chanderpaul (WI) | 1994-2015 | 50.93 | 0.8 | 1.68 | 49.41 | -0.3% | 49.26 | -26.4% |
| 30 | G Headley (WI) | 1930-39 | 66.72 | nil | 1.89 | 52.19 | -6.0% | 49.07 | -26.7% |
| 31 | B Azam (Pak) | 2016-23 | 48.63 | nil | 1.62 | 48.63 | nil | 48.63 | -27.4% |
| 32 | M Jayawardene (SL) | 1997-2014 | 49.84 | 1.5 | 1.62 | 48.62 | -0.2% | 48.53 | -27.5% |
| 33 | M Clarke (Aus) | 2004-15 | 49.10 | 1.3 | 1.61 | 48.47 | nil | 48.47 | -27.6% |
| 34 | T Samaraweera (SL) | 2001-13 | 48.76 | 0.7 | 1.60 | 48.40 | nil | 48.40 | -27.7% |
| 35 | C Walcott (WI) | 1948-60 | 56.58 | 1.6 | 1.77 | 50.60 | -4.8% | 48.16 | -28.1% |
| 36 | S Waugh (Aus) | 1985-2004 | 51.06 | 0.5 | 1.61 | 48.48 | -1.2% | 47.90 | -28.5% |
| 37 | S Gavaskar (Ind) | 1971-87 | 51.12 | nil | 1.68 | 49.41 | -3.1% | 47.89 | -28.5% |
| 38 | G Smith (SA) | 2002-14 | 48.25 | 0.9 | 1.56 | 47.83 | nil | 47.83 | -28.6% |
| 39 | V Kohli (Ind) | 2011-23 | 48.72 | 1.9 | 1.56 | 47.79 | nil | 47.79 | -28.6% |
| 40 | Inzamam-ul-Haq (Pak) | 1992-2007 | 49.60 | 0.7 | 1.57 | 47.95 | -0.6% | 47.68 | -28.8% |
| 41 | A Border (Aus) | 1978-94 | 50.56 | 0.3 | 1.62 | 48.62 | -2.5% | 47.42 | -29.2% |
| 42 | U Khawaja (Aus) | 2011-23 | 47.68 | 1.4 | 1.50 | 47.00 | nil | 47.00 | -29.8% |
| 43 | V Richards (WI) | 1974-91 | 50.23 | 0.9 | 1.59 | 48.22 | -2.8% | 46.89 | -30.0% |
| 44 | L Hutton (Eng) | 1937-55 | 56.67 | 1.4 | 1.70 | 49.68 | -5.6% | 46.88 | -30.0% |
| 45 | A Gilchrist (Aus) | 1999-2008 | 47.60 | 1.4 | 1.48 | 46.76 | -0.1% | 46.71 | -30.2% |
| 46 | A Shrewsbury (Eng) | 1882-93 | 35.47 | nil | 1.78 | 50.74 | -8.0% | 46.66 | -30.3% |
| 47 | Misbah-ul-Haq (Pak) | 2001-17 | 46.62 | nil | 1.47 | 46.62 | nil | 46.62 | -30.4% |
| 48 | K Pietersen (Eng) | 2005-14 | 47.28 | 1.7 | 1.46 | 46.47 | nil | 46.47 | -30.6% |
| 49 | D Martyn (Aus) | 1992-2006 | 46.37 | nil | 1.43 | 46.10 | -0.1% | 46.04 | -31.2% |
| 50 | KS Ranjitsinhji (Eng) | 1896-1902 | 44.95 | nil | 1.68 | 49.41 | -7.4% | 45.74 | -31.7% |
| 51 | H Amla (SA) | 2004-19 | 46.64 | 2.0 | 1.40 | 45.71 | nil | 45.71 | -31.7% |
| 52 | T Head (Aus) | 2018-23 | 46.80 | 2.5 | 1.39 | 45.63 | nil | 45.63 | -31.9% |
| 53 | R Sharma (Ind) | 2013-23 | 45.22 | nil | 1.36 | 45.22 | nil | 45.22 | -32.5% |
| 54= | VVS Laxman (Ind) | 1996-2012 | 45.97 | 0.9 | 1.36 | 45.17 | -0.3% | 45.03 | -32.7% |
| S Katich (Aus) | 2001-10 | 45.03 | nil | 1.35 | 45.03 | nil | 45.03 | -32.8% | |
| 56 | A Cook (Eng) | 2006-18 | 45.35 | 0.9 | 1.34 | 44.95 | nil | 44.95 | -32.9% |
| 57 | WG Grace (Eng) | 1880-93 | 36.54 | nil | 1.65 | 49.01 | -8.3% | 44.94 | -32.9% |
| 58 | M Richardson (NZ) | 2000-04 | 44.77 | nil | 1.33 | 44.77 | nil | 44.77 | -33.1% |
| 59 | G Kirsten (SA) | 1993-2004 | 47.25 | 1.5 | 1.34 | 44.91 | -0.7% | 44.58 | -33.4% |
| 60 | R Taylor (NZ) | 2007-22 | 44.66 | 0.5 | 1.30 | 44.44 | nil | 44.44 | -33.6% |
| 61 | H Sutcliffe (Eng) | 1924-35 | 60.73 | nil | 1.55 | 47.69 | -6.8% | 44.43 | -33.6% |
| 62 | A Mathews (SL) | 2009-23 | 44.93 | 1.4 | 1.29 | 44.30 | nil | 44.30 | -33.8% |
| 63 | D Warner (Aus) | 2011-23 | 44.61 | 1.0 | 1.28 | 44.16 | nil | 44.16 | -34.0% |
| 64 | J Langer (Aus) | 1993-2007 | 45.27 | 0.5 | 1.29 | 44.24 | -0.6% | 44.00 | -34.3% |
| 65 | KD Walters (Aus) | 1965-81 | 48.26 | 0.6 | 1.40 | 45.70 | -3.8% | 43.96 | -34.3% |
| 66 | JF Reid (NZ) | 1979-86 | 46.28 | nil | 1.36 | 45.17 | -2.9% | 43.87 | -34.5% |
| 67 | D Jones (Aus) | 1984-92 | 46.65 | nil | 1.33 | 44.77 | -2.2% | 43.77 | -34.6% |
| 68 | C Pujara (Ind) | 2010-23 | 43.60 | nil | 1.24 | 43.60 | nil | 43.60 | -34.9% |
| 69 | G Boycott (Eng) | 1964-82 | 47.72 | nil | 1.37 | 45.30 | -3.8% | 43.59 | -34.9% |
| 70 | CP Mead (Eng) | 1911-28 | 49.37 | nil | 1.50 | 47.03 | -7.5% | 43.50 | -35.0% |
| 71 | R Pant (Ind) | 2018-22 | 43.67 | 0.6 | 1.23 | 43.41 | nil | 43.41 | -35.2% |
| 72 | D Nourse (SA) | 1935-51 | 53.81 | nil | 1.44 | 46.23 | -6.3% | 43.30 | -35.3% |
| 73 | J Trott (Eng) | 2009-15 | 44.08 | 2.2 | 1.20 | 43.11 | nil | 43.11 | -35.6% |
| 74 | C Lloyd (WI) | 1966-85 | 46.67 | 0.5 | 1.32 | 44.64 | -3.6% | 43.04 | -35.7% |
| 75 | M Trescothick (Eng) | 2000-06 | 43.79 | 2.0 | 1.19 | 42.91 | nil | 42.91 | -35.9% |
| 76 | KS Duleepsinhji (Eng) | 1929-31 | 58.52 | nil | 1.43 | 46.10 | -6.9% | 42.89 | -35.9% |
| 77 | W Hammond (Eng) | 1927-47 | 58.45 | 1.8 | 1.42 | 45.97 | -6.8% | 42.84 | -36.0% |
| 78 | G Thorpe (Eng) | 1993-2005 | 44.66 | 0.9 | 1.19 | 42.92 | -0.7% | 42.62 | -36.4% |
| 79 | Saeed Anwar (Pak) | 1990-2001 | 45.52 | nil | 1.20 | 43.05 | -1.1% | 42.59 | -36.4% |
| 80 | S Nurse (WI) | 1960-69 | 46.60 | nil | 1.30 | 44.38 | -4.4% | 42.42 | -36.6% |
| 81 | R Kanhai (WI) | 1957-74 | 47.53 | 0.5 | 1.26 | 43.85 | -3.4% | 42.35 | -36.8% |
| 82 | D Amiss (Eng) | 1966-77 | 46.30 | nil | 1.28 | 44.11 | -4.1% | 42.32 | -36.8% |
| 83 | C Gayle (WI) | 2000-14 | 42.18 | nil | 1.13 | 42.18 | nil | 42.18 | -37.0% |
| 84 | F Worrell (WI) | 1948-63 | 49.48 | 1.2 | 1.31 | 44.51 | -5.4% | 42.12 | -37.1% |
| 85 | M Azharuddin (Ind) | 1985-2000 | 45.03 | 2.1 | 1.18 | 42.79 | -1.7% | 42.05 | -37.2% |
| 86 | D Boon (Aus) | 1984-96 | 43.65 | nil | 1.19 | 42.92 | -2.1% | 42.02 | -37.2% |
| 87 | D Compton (Eng) | 1937-57 | 50.06 | 1.0 | 1.33 | 44.77 | -6.2% | 41.98 | -37.3% |
| 88 | W Lawry (Aus) | 1961-71 | 47.15 | nil | 1.26 | 43.85 | -4.4% | 41.92 | -37.4% |
| 89 | Azhar Ali (Pak) | 2010-22 | 42.26 | 1.2 | 1.10 | 41.75 | nil | 41.75 | -37.6% |
| 90 | ER Dexter (Eng) | 1958-68 | 47.89 | nil | 1.25 | 43.71 | -4.5% | 41.73 | -37.7% |
| 91 | G Greenidge (WI) | 1974-91 | 44.72 | 0.4 | 1.20 | 43.05 | -3.1% | 41.72 | -37.7% |
| 92 | I Bell (Eng) | 2004-15 | 42.69 | 2.4 | 1.10 | 41.67 | nil | 41.67 | -37.8% |
| 93 | A Prince (SA) | 2002-11 | 41.64 | nil | 1.09 | 41.64 | nil | 41.64 | -37.8% |
| 94 | M Crowe (NZ) | 1982-95 | 45.36 | 2.2 | 1.16 | 42.52 | -2.2% | 41.60 | -37.9% |
| 95 | D Cullinan (SA) | 1993-2001 | 44.21 | 1.0 | 1.12 | 41.99 | -1.0% | 41.56 | -37.9% |
| 96 | G Gambhir (India) | 2004-16 | 41.95 | 1.0 | 1.09 | 41.53 | nil | 41.53 | -38.0% |
| 97 | R Richardson (WI) | 1983-95 | 44.39 | nil | 1.15 | 42.39 | -2.1% | 41.49 | -38.0% |
| 98 | W Murdoch (Aus) | 1877-92 | 31.31 | nil | 1.38 | 45.44 | -9.0% | 41.36 | -38.2% |
| 99 | D Gower (Eng) | 1978-92 | 44.25 | 0.6 | 1.16 | 42.52 | -2.7% | 41.35 | -38.2% |
| 100 | M Vaughan (Eng) | 1999-2008 | 41.44 | nil | 1.07 | 41.33 | -0.1% | 41.27 | -38.4% |
| 101 | Zaheer Abbas (Pak) | 1969-85 | 44.79 | 0.5 | 1.19 | 42.92 | -3.9% | 41.26 | -38.4% |
| 102= | R Simpson (Aus) | 1957-78 | 46.81 | nil | 1.21 | 43.18 | -4.5% | 41.23 | -38.4% |
| Shoaib Mohammad (Pak) | 1983-95 | 44.34 | 1.8 | 1.13 | 42.12 | -2.1% | 41.23 | -38.4% | |
| 104 | S Ganguly (India) | 1996-2008 | 42.17 | 0.4 | 1.07 | 41.33 | -0.4% | 41.16 | -38.5% |
| 105 | H Gibbs (SA) | 1996-2008 | 41.95 | 0.6 | 1.07 | 41.33 | -0.4% | 41.16 | -38.5% |
| 106 | N Harvey (Aus) | 1948-63 | 48.41 | 1.7 | 1.22 | 43.32 | -5.5% | 40.95 | -38.8% |
| 107 | G Turner (NZ) | 1969-83 | 44.64 | nil | 1.16 | 42.52 | -3.8% | 40.89 | -38.9% |
| 108 | A Kallicharran (WI) | 1972-81 | 44.43 | nil | 1.16 | 42.52 | -3.9% | 40.86 | -39.0% |
| 109 | T Latham (NZ) | 2014-23 | 41.53 | 1.9 | 1.03 | 40.74 | nil | 40.74 | -39.2% |
| 110 | Saleem Malik (Pak) | 1982-99 | 43.69 | 0.7 | 1.08 | 41.46 | -2.0% | 40.62 | -39.3% |
| 111 | S Dhawan (Ind) | 2013-18 | 40.61 | nil | 1.02 | 40.61 | nil | 40.61 | -39.4% |
| 112 | V Hazare (Ind) | 1946-53 | 47.65 | nil | 1.22 | 43.32 | -6.3% | 40.60 | -39.4% |
| 113 | R Smith (Eng) | 1988-96 | 43.67 | nil | 1.05 | 41.06 | -1.7% | 40.36 | -39.7% |
| 114 | AH Jones (NZ) | 1987-95 | 44.27 | 1.9 | 1.05 | 41.06 | -1.9% | 40.30 | -39.8% |
| 115 | Aravinda de Silva (SL) | 1984-2002 | 42.97 | 0.5 | 1.04 | 40.93 | -1.7% | 40.25 | -39.9% |
| 116 | A Faulkner (SA) | 1906-24 | 40.79 | nil | 1.26 | 43.85 | -8.3% | 40.21 | -40.0% |
| 117 | M Taylor (Aus) | 1989-99 | 43.49 | nil | 1.03 | 40.80 | -1.5% | 40.20 | -40.0% |
| 118 | E Barlow (SA) | 1961-70 | 45.74 | nil | 1.13 | 42.12 | -4.6% | 40.19 | -40.0% |
| 119 | M Slater (Aus) | 1993-2001 | 42.83 | 0.3 | 1.01 | 40.53 | -1.1% | 40.10 | -40.1% |
| 120 | PBH May (Eng) | 1951-61 | 46.77 | 0.8 | 1.14 | 42.26 | -5.6% | 39.89 | -40.4% |
| 121 | D Haynes (WI) | 1978-94 | 42.29 | nil | 1.02 | 40.67 | -2.7% | 39.58 | -40.9% |
| 122 | M Amarnath (India) | 1969-88 | 42.50 | nil | 1.05 | 41.06 | -3.7% | 39.54 | -40.9% |
| 123 | P McDonnell (Aus) | 1880-88 | 29.93 | nil | 1.24 | 43.58 | -9.3% | 39.51 | -41.0% |
| 124 | D Vengsarkar (India) | 1976-92 | 42.13 | nil | 1.02 | 40.67 | -3.0% | 39.44 | -41.1% |
| 125 | N O’Neill (Aus) | 1958-65 | 45.55 | nil | 1.08 | 41.46 | -4.9% | 39.42 | -41.1% |
| 126= | H Tillakaratne (SL) | 1989-2004 | 41.70 | nil | 0.95 | 39.74 | -1.0% | 39.34 | -41.2% |
| G Gooch (Eng) | 1975-95 | 42.58 | 0.9 | 1.00 | 40.40 | -2.6% | 39.34 | -41.2% | |
| 128 | A Morris (Aus) | 1946-55 | 46.48 | 0.8 | 1.12 | 41.99 | -6.5% | 39.28 | -41.3% |
| 129 | C Hunte (WI) | 1958-67 | 45.06 | nil | 1.05 | 41.06 | -4.9% | 39.05 | -41.7% |
| 130 | I Redpath (Aus) | 1964-76 | 43.45 | 0.6 | 1.03 | 40.80 | -4.5% | 38.98 | -41.8% |
| 131 | L Hassett (Aus) | 1938-53 | 46.56 | 1.6 | 1.10 | 41.73 | -6.6% | 38.96 | -41.8% |
| 132 | C Hill (Aus) | 1896-1912 | 39.21 | nil | 1.16 | 42.52 | -8.7% | 38.83 | -42.0% |
| 133 | R Fredericks (WI) | 1968-77 | 42.49 | nil | 1.01 | 40.53 | -4.4% | 38.77 | -42.1% |
| 134 | T Graveney (Eng) | 1951-69 | 44.38 | nil | 1.04 | 40.93 | -5.3% | 38.76 | -42.1% |
| 135 | J Edrich (Eng) | 1963-76 | 43.54 | 1.4 | 1.01 | 40.53 | -4.6% | 38.69 | -42.2% |
| 136 | I Chappell (Aus) | 1964-80 | 42.42 | 0.7 | 1.00 | 40.40 | -4.4% | 38.61 | -42.3% |
| 137 | V Trumper (Aus) | 1899-1912 | 39.04 | nil | 1.14 | 42.26 | -8.7% | 38.59 | -42.4% |
| 138 | C Cowdrey (Eng) | 1954-75 | 44.06 | 0.3 | 1.01 | 40.53 | -5.0% | 38.52 | -42.5% |
| 139 | Hanif Mohammad (Pak) | 1952-69 | 43.98 | nil | 1.00 | 40.40 | -5.3% | 38.26 | -42.9% |
| 140 | C Macartney (Aus) | 1907-26 | 41.78 | nil | 1.05 | 41.06 | -8.7% | 37.51 | -44.0% |
| 141 | V Merchant (Ind) | 1933-51 | 47.72 | nil | 1.00 | 40.40 | -7.3% | 37.47 | -44.0% |
| 142 | B Mitchell (SA) | 1929-49 | 48.88 | nil | 1.00 | 40.40 | -7.5% | 37.36 | -44.2% |
| 143 | V Ransford (Aus) | 1907-12 | 37.84 | nil | 1.03 | 40.80 | -9.1% | 37.11 | -44.6% |
| 144 | W Bates (Eng) | 1882-87 | 27.33 | nil | 1.04 | 40.93 | -9.9% | 36.86 | -45.0% |
| 145 | G Gunn (Eng) | 1907-30 | 40.00 | nil | 1.00 | 40.40 | -8.9% | 36.82 | -45.0% |
What to do About any Remaining Oddities?
Finally, for those who might find the rankings of Table 3 broadly satisfactory, what should be done in respect of any oddities – ie players considered to be well out of their warranted position?
In my view, it is far better to identify reasons and alter the standardising model to suit than to try an ad hoc repositioning of a particular player, as the “reasons” are likely to relate to some other players also. Eg to take account of reduced performance after a major break due to injury/illness or whatever. That’s the scientific approach: keep iterating until the model applied gives sufficiently acceptable results.


Leave a comment