A Study in Impact, Part 2 – Gavaskar onwards, with a close look at Vivi and Gilly
Dave Wilson |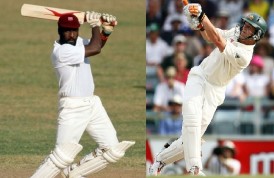
This feature follows on from the first in this series which reviewed the impact of players’ batting up to and including Greg Chappell. I was very pleased to see that this impact measure highlighted the value of Victor Trumper in a way which his batting average is not able to do, and was keen to see how more modern players might fare when measured by the same yardstick.
That yardstick is of course Donald Bradman, insofar as his impact value is compared to that of all other batsmen and extrapolated to give an equivalent impact average on the same scale as traditional batting average. The method is as follows.
The match impact rating that I proposed previously is expressed as a percentage per Test, e.g. Garry Sobers’ match impact per Test might be worth say 21%, whereas Dennis Lillee might be worth 19%, but those figures don’t really mean much to anyone else but me as there’s no real frame of reference. So what I decided to do was to a) separate out the impact solely based on each player’s batting, then b) extrapolate that to a value which is equivalent to the range of Test batting averages, with the intent being to provide a rating scale with which those who follow cricket would be familiar.
I assumed that the obvious basis to scale from is the impact of Don Bradman. As was seen with my full impact exercise Bradman is the highest rated pure batsman (no adjustment for opponent) and as a result will surely have the highest impact from batting only, so we can use his batting impact rating and Test batting average to scale from. In order to scale the others I had to run Bradman’s batting impact separately first and this gave me a figure of 22.06% – that is the equivalent impact average figure which is equated to Bradman’s batting average of 99.94. In this way, once I ran each player’s batting impact I could then scale it to an equivalent batting average scale by comparing it to Bradman and basing it on a 99.94 batting average (which figure just seems to look more ridiculous every time I read or write it!). Applying a linear transformation, that gives us a value of around 11% as being the equivalent of a batting average of around 50 (actually 11.03% to 49.97).
As we had cut off last time following the impact rating for Greg Chappell, we start this time with legendary Indian opening batsman, Sunil Gavaskar. Bradman’s numbers are shown below for reference, showing his Equivalent Impact Average, Actual Batting Average and Impact Percentage:-
| EquivAvg | ActAvg | Imp% | Player |
| 99.94 | 99.94 | 22.06% | DG Bradman (Aus) |
As Bradman is used as the yardstick his equivalent impact average is the same as his career batting average (in the next feature, which will include impact figures for the first 20, 30, etc. Tests of a batsman’s career, we will see Bradman’s impact average exceed 100). All other batsman are rated based on the above figures. Here is how the modern players fare.
Group 1
| EquivAvg | ActAvg | Imp% | Player |
| 59.53 | 51.12 | 13.15% | SM Gavaskar (Ind) |
| 46.12 | 44.72 | 10.18% | CG Greenidge (WI) |
| 53.50 | 50.24 | 11.81% | IVA Richards (WI) |
| 48.66 | 52.57 | 10.74% | Javed Miandad (Pak) |
| 52.78 | 42.58 | 11.65% | GA Gooch (Eng) |
| 45.26 | 44.25 | 9.99% | DI Gower (Eng) |
When measured using this impact scale Sunil Gavaskar shows up as having had significant impact as compared to how he is rated by his batting average. I have already discussed in previous features how, with this measure, Gooch rates highly as compared to Gower. As regards Viv Richards, although he increased quite a bit I was disappointed it wasn’t a more significant delta when considering his apparent impact, and I will discuss this further at the end of this feature. Note that the division into groups is basically determined by CricketArchive player numbers.
Group 2
| EquivAvg | ActAvg | Imp% | Player |
| 46.98 | 50.56 | 10.37% | AR Border (Aus) |
| 44.31 | 45.37 | 9.78% | MD Crowe (NZ) |
| 44.53 | 42.98 | 9.83% | PA de Silva (SL) |
| 48.04 | 51.06 | 10.15% | SR Waugh (Aus) |
| 48.38 | 43.50 | 10.68% | MA Taylor (Aus) |
| 43.94 | 37.70 | 9.70% | MA Atherton (Eng) |
Openers Mark Taylor and Michael Atherton both move up significantly when taking into account the actual impact of their batting as opposed to measuring success by traditional batting average. Steve Waugh drops a little, though not much, and becomes comparable to Taylor as regards batting impact.
Group 3
| EquivAvg | ActAvg | Imp% | Player |
| 46.03 | 43.06 | 10.16% | DL Houghton (Zim) |
| 52.82 | 51.55 | 11.66% | A Flower (Zim) |
| 68.14 | 52.88 | 15.04% | BC Lara (WI) |
| 42.59 | 40.86 | 9.40% | ST Jayasuriya (SL) |
| 49.02 | 44.66 | 10.82% | GP Thorpe (Eng) |
| 51.33 | 49.60 | 11.33% | Inzamam-ul-Haq (Pak) |
This group are largely unaffected whether or not they are measured by batting average or impact average, with two exceptions. Graham Thorpe, the man who gave way to Kevin Pietersen, shows by this measure as a much more impactful batsman than his average gives him credit for. But Brian Lara is in a class apart – his equivalent impact average of 68.14 is second only to Bradman to this point.
Group 4
| EquivAvg | ActAvg | Imp% | Player |
| 58.80 | 53.78 | 12.98% | SR Tendulkar (Ind) |
| 41.77 | 40.07 | 9.22% | SP Fleming (NZ) |
| 54.27 | 50.74 | 11.98% | ML Hayden (Aus) |
| 47.12 | 45.97 | 10.05% | VVS Laxman (Ind) |
| 52.01 | 51.85 | 11.48% | RT Ponting (Aus) |
| 54.09 | 52.31 | 11.94% | R Dravid (Ind) |
Sachin Tendulkar takes a significant increase based on equivalent average and is one of the highest rated impact batsmen ever, though notably his impact measures at slightly less than his compatriot Sunil Gavaskar. Sticking with Indian batsmen, I had thought that Laxman would rate higher, though he does receive a slight increase, as does Rahul Dravid.
Group 5
| EquivAvg | ActAvg | Imp% | Player |
| 57.26 | 52.29 | 12.64% | Mohammad Yousuf (Pak) |
| 48.20 | 47.61 | 10.64% | AC Gilchrist (Aus) |
| 41.68 | 41.44 | 9.20% | MP Vaughan (Eng) |
| 56.63 | 55.37 | 12.50% | JH Kallis (SA) |
| 53.05 | 49.84 | 11.71% | DPMD Jayawardene (SL) |
| 51.42 | 43.80 | 11.35% | ME Trescothick (Eng) |
I was glad to see that Mohammad Yousuf rates significantly higher when measured by his impact, as do Marcus Trescothick and Mahela Jayawardene. Kallis rates highly but then he does so when measured by his batting average. The small increase for Adam Gilchrist demands further discussion in the same way as Viv Richards does – see later in the feature.
Group 6
| EquivAvg | ActAvg | Imp% | Player |
| 54.05 | 49.34 | 11.93% | V Sehwag (Pak) |
| 52.29 | 40.89 | 11.53% | AJ Strauss (Eng) |
| 59.12 | 57.40 | 13.05% | KC Sangakkara (SL) |
| 58.62 | 48.25 | 12.94% | GC Smith (SA) |
| 54.86 | 52.05 | 12.11% | Younis Khan (Pak) |
Big increases for both Andrew Strauss and especially Graeme Smith, bringing him close to Kumar Sangakkara with two of the highest impact scores ever. In fact, all of this group fare better when rated by impact than by batting average.
Slight digression – What exactly do I mean by impact?
When we think of impact, we tend to think of the batsmen who can seemingly turn a game in a heartbeat, like the aforementioned Richards, Gilchrist and Virender Sehwag. But impact doesn’t have to be instant – what we are measuring and giving the batsmen credit for here is based on the impact of his innings on the state of the match, whether that happens releatively quickly or relatively slowly. It’s easy to see the impact of Lara’s 153* in the successful run chase against Australia in 1999, as he turned what was a losing proposition into victory, but it’s not so easy to see the impact of a great first innings performance, when there is still no much cricket to play.
So we have to rely on probability to gauge the impact of such an innings, i.e. what is the most likely result given the present circumstances of the match, in order to provide a realistic assessment of the impact of an innings at any time in the game. Hence a steady batsman like Dravid can have as much impact, at least in Tests, as a batsman with more instant impact like Sehwag.
Group 7
| EquivAvg | ActAvg | Imp% | Player |
| 48.97 | 49.11 | 10.81% | MJ Clarke (Aus) |
| 50.74 | 47.29 | 11.20% | KP Pietersen (Eng) |
| 46.48 | 50.66 | 10.26% | AB de Villiers (SA) |
| 53.28 | 45.73 | 11.76% | AN Cook (Eng) |
| 50.29 | 47.22 | 11.10% | LRPL Taylor (NZ) |
Quite a big increase for Cook, while the rest of this group moves around slightly up or down.
Group 8
| EquivAvg | ActAvg | Imp% | Player |
| 52.91 | 51.37 | 11.68% | S Chanderpaul (WI) |
| 61.57 | 61.37 | 13.59% | SPD Smith (Aus) |
| 52.73 | 50.35 | 11.64% | KS Williamson (NZ) |
| 51.56 | 48.20 | 11.38% | DA Warner (Aus) |
| 53.40 | 52.33 | 11.55% | V Kohli (Ind) |
| 46.75 | 52.28 | 10.32% | JE Root (Eng) |
All of the current greats rate similarly highly when looking at impact or batting average, with the exception of Joe Root; this may be connected to his relatively low conversion rate, 24.5% as against almost 50% for Steve Smith and a whopping 57% for Kohli.
In summary, the above lists focus on 46 batsmen, which considering the number of Tests played is about equivalent to the 33 we looked at last time. In the next feature I’ll combine the two lists and discuss the all-time most impactful batsmen, however to conclude this piece I’d like to revisit Viv Richards and Adam Gilchrist.
Vivi and Gilly – why aren’t they rated higher on career impact?
I am old enough to recall Viv Richards’ batting masterclass during the red hot summer of 1976, when in just four Tests he plundered the England attack to the tune of 829 runs. Over his first 21 Tests he boasted a career average of 64.15 and he would go on to play in 100 more Tests, though his average would never surpass that mark. Below is a table showing how his average, and equivalent impact average, fared over time:-
| Tests | EquivAvg | ActAvg | Imp% |
| 22 | 76.65 | 64.03 | Imp% |
| 43 | 70.13 | 62.76 | Imp% |
| 73 | 59.12 | 53.64 | Imp% |
| 121 | 53.50 | 50.24 | 11.81% |
We can see that Richards’ equivalent impact average was incredibly high after his first 20-odd Tests, and indeed was still massive after 43 Tests – only Bradman ever rated higher after so many Tests. But Richards’ batting average over the rest of his Test career was just 43.51, as compared to 62.76 before that. In equivalent impact the difference is even more extreme, 70.13 as compared to 43.94.
Looking at Gilly, we see a similar trend. In his last 50 Tests he averaged less than 38 with the bat, and in equivalent impact average the comparison between his first 30 Tests to the remainder is 71.04 as compared to only 40.41.
In the final feature I’ll also compare the best ever after a number of Tests, i.e. after 20 Tests, 30 Tests etc.
I’m confident that Vivi and Gilly should look pretty good in that case.


Leave a comment