• Welcome to the Cricket Web forums, one of the biggest forums in the world dedicated to cricket.

    You are currently viewing our boards as a guest which gives you limited access to view most discussions and access our other features. By joining our free community you will have access to post topics, respond to polls, upload content and access many other special features. Registration is fast, simple and absolutely free so please, join the Cricket Web community today!

    If you have any problems with the registration process or your account login, please contact us.

Adjusting the batting average based on actual quality

srbhkshk

International Captain
Here's a few more retired bowlers of the modern era with careers of importance, outside the very top bowlers list. The regression model extrapolation holds up better than I expected:

Ian Botham:
Regression Adjusted Average = 27.03 Delta = -1.374

Anil Kumble:
Regression Adjusted Average = 27.86 Delta = -1.789

Jacques Kallis:
Regression Adjusted Average = 33.91 Delta = 1.260

Did you ever put out these numbers for the active batting and bowling greats? Or does the system not support them atm?
 

shortpitched713

Cricketer Of The Year
I put no stock in these kind of ratings exercises at all, but your issues here look like "shortpitched713 problems" rather than actual problems with the system. You think Philander and Kaneria are better than they are so when they don't end up as high as you want it's because of "nationalism"
Those are just two examples. I tend to just think, underresearched players at that ranking level + flagging voter interest created a scenario where the big 3 fan base countries ended up being way overrepresented at the lower end of the poll result.
 

shortpitched713

Cricketer Of The Year
Did you ever put out these numbers for the active batting and bowling greats? Or does the system not support them atm?
It would require more work. Which I'm not really able to do at the moment, or even for the foreseeable future. :(

My methodology was laid out pretty clearly, for anyone who wants to continue that work.
 

Nintendo

Cricketer Of The Year

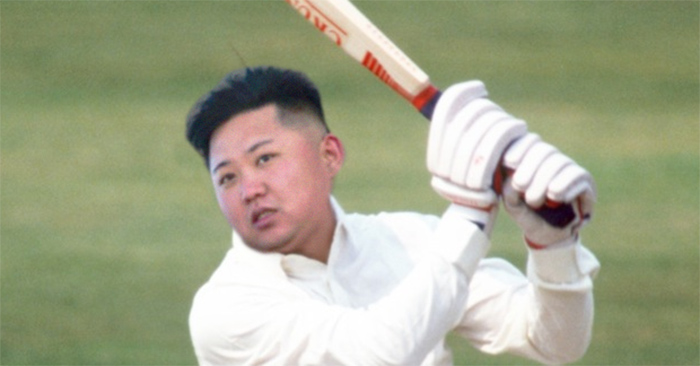
Kim jong un made his infamous 807* against Cuba and that game got test status somehow. Massive minnow bully.
 

ankitj

Cricket Web: All-Time Legend

Kim jong un made his infamous 807* against Cuba and that game got test status somehow. Massive minnow bully.
Parody? Can't be sure hence asking.
 

ankitj

Cricket Web: All-Time Legend
It's obviously fake news but North Koreans could be believing this in earnest so it may not be parody. Check this:


shortpitched713

Cricketer Of The Year
Have gone ahead and done this for the bowlers too. The methodology here was to set ICC Ranking average as numerator, and multiply by MVP model score (which usefully adds in a nice away record consideration as well) and place the era adjusted bowling average as the denominator. The correlation is not as strong as for the batsmen ( just shy of .7 ), but it's still not bad. Inclusion of spinners only reduced that correlation by a negligible .01, so I feel comfortable including them, although they end up with very different residuals. I have to also account for the fact that all things are not equal ( i.e. spinners are used more in stock roles regardless of quality). So while these bowlers are sorted in the order of the original regression value, I made an adjustment based on the original residuals to slightly increase spinner averages (and very, very slightly decrease seamer ones). The final results look a bit more "realistic" for both bowler categories.

BowlerRegression Adjusted AverageActual AverageDelta
Glenn Mcgrath
21.42793​
21.64​
-0.21207​
Muttiah Muralitharan
23.27961​
22.72​
0.559614​
Dale Steyn
21.77292​
22.95​
-1.17708
Curtly Ambrose
21.83116​
20.99​
0.841163​
Richard Hadlee
22.14589​
22.29​
-0.14411​
Malcolm Marshall
22.36784​
20.94​
1.427839
Allan Donald
22.42278​
22.25​
0.172784​
Joel Garner
22.79065​
20.97​
1.820645
Shaun Pollock
22.99114​
23.11​
-0.11886​
Imran Khan
23.56562​
22.81​
0.755615​
Wasim Akram
23.566​
23.62​
-0.054​
Shane Warne
25.25136​
25.41​
-0.15864​
Vernon Philander
23.60542​
22.32​
1.285421
Dennis Lillee
23.74988​
23.92​
-0.17012​
Waqar Younis
23.8438​
23.56​
0.283803​
0.3408​

The average delta ended up being slightly positive ( meaning more of these players came from the somewhat more bowling friendly eras of the overall modern era).

Also, it turns out you can't square the circle of batting friendly conditions for SA bats, and bowling friendly ones for SA bowlers, unless you're a bowler like Philander who has a significantly worse record away (therein being hurt by the MVP model consideration). So Steyn ends up coming out as the only bowler with a negative delta magnitude over 1 .

ICC/MVPCareer Impact ModelMultiplied
Murali
7432292.962​
67459.11158​
50137588.02​
McGrath
8173927.159​
55142.4876​
45073067.7​
Hadlee
6640173.385​
59726.78749​
39659622.46​
Steyn
7390804.515​
51991.62017​
38425990.11​
Marshall
6235483.868​
57977.13897​
36151551.48​
Ambrose
7267354.325​
40830.00099​
29672608.43​
Donald
6139761.699​
41925.2685​
25741115.77​
Imran
4487644.032​
45693.82073​
20505760.19​

I've included the raw values from the ICC/MVP model that I used to calculate the initial regression for this. Now comparing it to the raw values of the more impact oriented model I had made in the below thread, and then multiplied together to get a new value for each bowler:


Think it's interesting to see how the models sort of differ in what they emphasize, but in the end have the same top few bowlers. Might make another regression using this, but cba right now, so leaving this as a placeholder.
 

kevinw

International Debutant
Isn't this what points rankings are meant to take into account. A guy who played mostly on roads and averages 50 is probably not as good as a guy who played mostly in England or NZ and averages 45....but rankings take into account those vagaries.
 

Coronis

Hall of Fame Member
Isn't this what points rankings are meant to take into account. A guy who played mostly on roads and averages 50 is probably not as good as a guy who played mostly in England or NZ and averages 45....but rankings take into account those vagaries.
In theory yes. In practice they do far from a perfect job.
 

Top