• Welcome to the Cricket Web forums, one of the biggest forums in the world dedicated to cricket.

    You are currently viewing our boards as a guest which gives you limited access to view most discussions and access our other features. By joining our free community you will have access to post topics, respond to polls, upload content and access many other special features. Registration is fast, simple and absolutely free so please, join the Cricket Web community today!

    If you have any problems with the registration process or your account login, please contact us.

Playing around with numbers out of boredom at late hours of the night.

Loony BoB

International Captain
Swervy said:
have a look at Afridi's last 50 ODI's batting figures, i think it kind of shows what I mean about him not relying on form, but more luck to be honest:

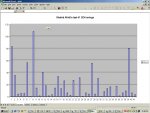
83,35,4,5,5,56,0,108*,14,1,40,18,1,3,14,33,13,26,62,27,0,31,0,6,4,55*,4,30,0,8,13,16,0,17,1,6,9,80,6,3

In those 50 innings, the best spell of double digit scores is 6 in a row,and that only included two scores of over 30.

If the hitting comes off, then great...but it is so rare that it just isnt worth Pakistan risking playing him
I was just reading the above post by Swervy and started thinking about how one would go about finding some kind of stats that could give an idea bout how reliable a batsman really is. I personally think if you want to check a batsman's consistency/reliability, it's best to go by something besides the average as one hefty innings can save a batsman's average after a fair few bad games. Of course, medians don't take into account not-outs... I was just playing around with this and wondered what would happen if I 'raise' the median by one innings for every not-out. This left me with these results (as examples):

Cairns
Tests: 41.5 (last 24 innings including 2 NO's)
ODI's: 29 (last 47 innings including 8 NO's)

Afridi
Tests: 15 (last 25 innings including 1 NO)
ODI's: 13 (last 49 innings including 1 NO)

Dravid
Tests: 72.5 (last 26 innings including 5 NO's)
ODI's: 49 (last 44 innings including 9 NO's)

Sehwag
Tests: 34 (last 26 innings including 0 NO's)
ODI's: 26 (last 50 innings including 3 NO's)


Unfortunately it turns out it didn't work so well with Glen McGrath (I had to test a bowler)... with his last 26 innings, he has 13 NO's and therefore his top score of 21 for tests came into play! I'm not sure on what I'd do if someone had over half of their innings with NO scores - which is what McGrath did with his ODI's - I just ended up using his top score. Of course, in the 2003 World Cup, I'm pretty sure Dravid or Tendulkar finished with an average higher than their high score since they had so many NO's, too, so I guess there's a fault in everything. Oh, if you're wondering...

McGrath
Tests: 21 (last 26 innings including 13 NO's)
ODI's: 11 (last 50 innings including 27 NO's)


Comparing these with averages (in order of highest to lowest, obviously only for the stated matches)...

Test Averages: Dravid (82.71), Sehwag (54.5), Cairns (50.22), Afridi (32.5), McGrath (10.23)
Test Medians: Dravid (72.5), Cairns (41.5), Sehwag (34), McGrath (21), Afridi (15)
ODI Averages: Dravid (43.85), Sehwag (35.4), Cairns (31.17), Afridi (22.85), McGrath (4.08)
ODI Medians: Dravid (49), Cairns (29), Sehwag (26), Afridi (13), McGrath (11)


So, er, to make a topic - how do you rate people when it comes to reliability and consistency? Do you think averages truely reflect such things? If not, do you think you can help find a way to show who is truely consistent/reliable? Oh, and also, does anyone else here play around with stats, or am I just a freak? Can you tell that I'm bored? I think it's probably about time I got to bed, huh? Yeah, I'm going to bed soon... late nights make me do strange things.
 

Swervy

International Captain
Loony BoB said:
I was just reading the above post by Swervy and started thinking about how one would go about finding some kind of stats that could give an idea bout how reliable a batsman really is. I personally think if you want to check a batsman's consistency/reliability, it's best to go by something besides the average as one hefty innings can save a batsman's average after a fair few bad games. Of course, medians don't take into account not-outs... I was just playing around with this and wondered what would happen if I 'raise' the median by one innings for every not-out. This left me with these results (as examples):

Cairns
Tests: 41.5 (last 24 innings including 2 NO's)
ODI's: 29 (last 47 innings including 8 NO's)

Afridi
Tests: 15 (last 25 innings including 1 NO)
ODI's: 13 (last 49 innings including 1 NO)

Dravid
Tests: 72.5 (last 26 innings including 5 NO's)
ODI's: 49 (last 44 innings including 9 NO's)

Sehwag
Tests: 34 (last 26 innings including 0 NO's)
ODI's: 26 (last 50 innings including 3 NO's)


Unfortunately it turns out it didn't work so well with Glen McGrath (I had to test a bowler)... with his last 26 innings, he has 13 NO's and therefore his top score of 21 for tests came into play! I'm not sure on what I'd do if someone had over half of their innings with NO scores - which is what McGrath did with his ODI's - I just ended up using his top score. Of course, in the 2003 World Cup, I'm pretty sure Dravid or Tendulkar finished with an average higher than their high score since they had so many NO's, too, so I guess there's a fault in everything. Oh, if you're wondering...

McGrath
Tests: 21 (last 26 innings including 13 NO's)
ODI's: 11 (last 50 innings including 27 NO's)


Comparing these with averages (in order of highest to lowest, obviously only for the stated matches)...

Test Averages: Dravid (82.71), Sehwag (54.5), Cairns (50.22), Afridi (32.5), McGrath (10.23)
Test Medians: Dravid (72.5), Cairns (41.5), Sehwag (34), McGrath (21), Afridi (15)
ODI Averages: Dravid (43.85), Sehwag (35.4), Cairns (31.17), Afridi (22.85), McGrath (4.08)
ODI Medians: Dravid (49), Cairns (29), Sehwag (26), Afridi (13), McGrath (11)


So, er, to make a topic - how do you rate people when it comes to reliability and consistency? Do you think averages truely reflect such things? If not, do you think you can help find a way to show who is truely consistent/reliable? Oh, and also, does anyone else here play around with stats, or am I just a freak? Can you tell that I'm bored? I think it's probably about time I got to bed, huh? Yeah, I'm going to bed soon... late nights make me do strange things.

something like standard deviation/variance would give an idea of how consistant a batsman is...it would be easy to knock up a spreadsheet to work it out (I dont have Excel on my pc though).

I will try and think of something later on to measure this
 

Linda

International Vice-Captain
Maybe if you put the scores on some sort of line graph, then you really could see how the batsman's scores vary.
Standard deviation would also give you the same thing I guess, just in number form, and it could tell you if the batsman scores are relatively close together or far apart (whether those scores are consistantly good, or consistantly bad).

This is kind of interesting... I'm going to try it out on a batsman. Now whom should I do..?!
 

Swervy

International Captain
Linda said:
Maybe if you put the scores on some sort of line graph, then you really could see how the batsman's scores vary.
Standard deviation would also give you the same thing I guess, just in number form, and it could tell you if the batsman scores are relatively close together or far apart (whether those scores are consistantly good, or consistantly bad).

This is kind of interesting... I'm going to try it out on a batsman. Now whom should I do..?!
i think two interesting comparisons would be Flintoff and Afridi in ODI's (similar averages, but i would guess Flintoff is more consistant)...one problem is how to deal with not outs
 

Linda

International Vice-Captain
Swervy said:
i think two interesting comparisons would be Flintoff and Afridi in ODI's (similar averages, but i would guess Flintoff is more consistant)...one problem is how to deal with not outs
Ok, Im starting to think that standard deviation wont work too well. For starters, players who've had big scores (ala Lara, Tendulkar, Ponting ect) are going to be slightly disadvantaged, because their higher scores are going to pull up the s.d.
Secondly, and blaringly obvious, is what do you do with not outs, like Swervy said. I cant think of anything that would be fair.

Anyway, just for starters I did three players standard deviations for ALL innnings. Not outs are just included as outs, and these stats are for Tests.

Ricky Ponting: 52.62, averaging 54.71
Chris Cairns: 32.88, averaging 33.97
Virender Sehwag: 62.03, averaging 52.72
Andrew Flintoff: 33.29, averaging 27.62

and, because I couldnt resist
Damien Martyn: 38.06, averaging 46.87 :D
 
Last edited:

Swervy

International Captain
Linda said:
Ok, Im starting to think that standard deviation wont work too well. For starters, players who've had big scores (ala Lara, Tendulkar, Ponting ect) are going to be slightly disadvantaged, because their higher scores are going to pull up the s.d.
Secondly, and blaringly obvious, is what do you do with not out's, like Swervy said. I cant think of anything that would be fair.

Anyway, just for starters I did three players standard deviations for ALL innnings. Not out's are just included as outs, and these stats are for Tests.

Ricky Ponting: 52.62
Chris Cairns: 32.88
Virender Sehwag: 62.03
Andrew Flintoff: 33.29

and, because I couldnt resist
Damien Martyn: 38.06 :D
sorry I am a bit confused..they just look like another average to me.

What a truely meaningful figure would be is and average followed by the standard deviation...statiscally a mean average means nothing without a SD figure...that will show the spread around the average score.

Maybe a good measure of consistancy would just be some figure like % of innings where score was within 20% either way of the players average...something quite simple like that.
 

Linda

International Vice-Captain
Swervy said:
sorry I am a bit confused..they just look like another average to me.
Its just the players standard deviation of all scores. I'll edit that post and put in the averages as well.

I just did one with Flintoff and Afridi like you asked, except to save time I did their last 30 ODI matches (xon is standard deviation, followed by average runs scored per innings over the 30 matches)..

Flintoff: xon- 21.18 @38.31
Afridi: xon-19.64 @17.35

I'm not even sure if we're getting anywhere here. Somehow I feel I am just giving you randomn numbers that are just calculated crap. :huh:
 

Swervy

International Captain
Linda said:
Its just the players standard deviation of all scores. I'll edit that post and put in the averages as well.

I just did one with Flintoff and Afridi like you asked, except to save time I did their last 30 ODI matches (xon is standard deviation, followed by average runs scored per innings over the 30 matches)..

Flintoff: xon- 21.18 @38.31
Afridi: xon-19.64 @17.35

I'm not even sure if we're getting anywhere here. Somehow I feel I am just giving you randomn numbers that are just calculated crap. :huh:
for Afridis last 30 odd innings (he has had one not out..a 55* followed by a 4, so I have counted that as being one complete innings of 59, to make up the 30 innings completed)..he has an average of 15.7 and a SD of 18.7

now for some one who scored a 200 and 271 and then 28 ducks..the average would be the same, but a SD of 60.5

now someone who scored the following:9. 10. 10. 10. 10. 12. 12. 13. 15.15. 15. 15. 15. 15. 15. 15. 15. 15. 15. 16. 19. 20. 20. 20. 20. 20. 22. 25. 25. 25.

that would give an average of about 16 and a SD of about 4.6.

So i think we are looking at anyone with a SD of more than there average is surley considered very up and down...some one who has an SD figure quite a long way lower than the mean average is very likely to get a score around there average.

So for Afridi, his SD is higher than his average over the last 30 innings and so cant be relied on to score his average score..and does occasionally get a big score.

Flintoff, whose SD is quite a lot lower than his average,can be relied on a lot more to score around his 38 average
 

Swervy

International Captain
and for Afridi to be not statiscally speaking reliable to score his average score which is very low, compared to Flintoffs, just shows what kind of batsman he has been recently..ie crap
 

Sehwag309

Banned
Linda said:
Maybe if you put the scores on some sort of line graph, then you really could see how the batsman's scores vary.
Standard deviation would also give you the same thing I guess, just in number form, and it could tell you if the batsman scores are relatively close together or far apart (whether those scores are consistantly good, or consistantly bad).

This is kind of interesting... I'm going to try it out on a batsman. Now whom should I do..?!
Perhaps this site would be helpful

HowSTAT
 

a massive zebra

International Captain
Surely something very simple like percentage of innings over 30 or 50 is not a bad guide to consistency, and it does not confuse everyone..
 

PY

International Coach
Strangely enough, that is exactly what I was thinking.

I understand all this stuff with standard deviations (although haven't done it in 2 years) and I can't help but think it is all a bit rough. For example, standard deviation only shows 96.4% (?) of the results within one standard deviation either side of the mean point. In that 3.6%, surely it could be completely thrown out? Not sure if I'm remembering correctly or not.

Something that would be slightly less accurate but a crapload easier to understand is as a_massive_zebra says is to just do percentage of innings above 30 runs?

*dreads what will happen when Neil or Corey (Top_Cat) see this* :p
 

Langeveldt

Soutie
Im amazed that there are substandard bowlers doing the rounds like Brad Williams and Adam Sanford in int. cricket and you lot are criticizing Brett Lee??? Unreal..
 

Swervy

International Captain
Langeveldt said:
Im amazed that there are substandard bowlers doing the rounds like Brad Williams and Adam Sanford in int. cricket and you lot are criticizing Brett Lee??? Unreal..
????
 

anzac

International Debutant
one thing that a graph shows better than numbers is as an indicator of current / recent form.............i.e. early career may have included a high number of 50+ scores etc in ratio to number of innings played, whereas current career may indicate only 1 such innings per series...........I think S Waugh's latter seasons were something like this which led to talk of his being dropped & actually contributed to the end of M Waugh's career?????

consequently IMO taking a player's consistency over their career figures may not be that relevant when considering current form - perhaps a better indication is a snap shot of the past 2 - 3 seasons as a mini career?????

how do they judge the rankings for top batsmen etc?????????

:cool:
 

Neil Pickup

Cricket Web Moderator
PY said:
Strangely enough, that is exactly what I was thinking.

I understand all this stuff with standard deviations (although haven't done it in 2 years) and I can't help but think it is all a bit rough. For example, standard deviation only shows 96.4% (?) of the results within one standard deviation either side of the mean point. In that 3.6%, surely it could be completely thrown out? Not sure if I'm remembering correctly or not.

Something that would be slightly less accurate but a crapload easier to understand is as a_massive_zebra says is to just do percentage of innings above 30 runs?

*dreads what will happen when Neil or Corey (Top_Cat) see this* :p
For approximate purposes, it's 68% inside one, 95% inside two and 99% inside three.

An interesting measure would be quartile skewness:

Q1 + Q3 - 2*median
--------------------
Q3 - Q1

Where Q3 = Upper Quartile, Q1 = Lower Quartile.

A negative number would mean a high concentration of numbers above the mean with only a few extreme lows [not gonna happen here] whilst a big positive number would be for an Afridi-esque batsman with a hit/miss approach and a lot of low scores.
 

Swervy

International Captain
i might do some experimenting with this some time this week (hunt out my old uni statistics notes,i knew they would come in handy at some point).

The problem with all these measures of dispersion is that there are a number you can use, it all depends on the type of data that is being used.

I am determined to get to the bottom of it... :D
 

Top