Highest Impact – the Most Impactful Test Players of All-Time
Dave Wilson |
My forum user name, chasingthedon, is a tongue-in-cheek reference to the fact that Don Bradman is lauded as the greatest cricketer ever, despite the fact that there was never really a way to compare him directly with bowlers and all-rounders. Now there is….
Cast your mind back
Eight years ago the IPL first swelled the coffers of players and organisers alike. At the same time I was busy trying to find a way of rating all cricketers together regardless of their main discipline. My first attempt was to create a Test player rating method called Series Points. A discussion (and critique) of that system, and the genesis of its replacement, Match Impact, were described in last week’s feature. After three years work Match Impact is complete and in this feature I’ll list the most impactful Test cricketers of all time.
Break on through to the other side
This method of rating is a breakthrough in terms of being able to objectively rate all cricketers together based on everything they do with bat and ball, as it is based on the direct impact of the player’s performance on his team’s chances of winning at the time the performance is made. It finally allows us to compare the previously incomparable Don Bradman’s contributions with the bat (and less significantly his performance in the field) with, for example, the all round deeds of Garry Sobers and Richard Hadlee, and the bowling feats of Sydney Barnes and Wasim Akram (plus their fielding and batting).
Note that the probability of winning is assessed at the time the performance is made, i.e. before and after a batting partnership, before and after a dismissal in the field or wicket taken. Therefore, the actual outcome of the match is not taken into account in the assessment of the player’s performance.
For example, when Ian Botham had Jeff Thomson caught by Geoff Miller to win the Boxing DayTest of 1982 against Australia in Melbourne by just three runs, it shows on the scorecard as simply one of his two wickets in the innings. A return of 2/80 at first glance wouldn’t seem to represent a great performance, but In the context of the match that wicket had enormous significance as regards England’s chances of winning before and after the dismissal. Similarly Doug Ring – his 32* turned a likely loss into an unexpected win when Australia beat West Indies in 1951-52, again at the MCG around the New Year – those 32 precious runs were worth more than many a century in terms of their impact on Australia’s chances of winning.
So having established the value of the impact measure, as described in the previous feature we can now get into the issue of who are the top impact players of all time. Before I list the top players though, I’d like to discuss a couple of points.
Raw deal
First, I’d like to demonstrate the danger of relying too heavily on the raw aggregate numbers. Now that all Test players’ career impact numbers are available for scrutiny, we can compare players directly – let’s start with Don Bradman and Justin Langer, two Australian batsmen with very similar career impact aggregates. Bradman’s raw career total is 1086, while Langer’s is 1114. Now I don;t think anyone, with the possible exception of Mrs. Langer, would consider that the Aussie opener should rank higher than the Don. If we compare Bradman’s career with Langer’s, we can see that Bradman appeared in 11 series, though almost all of these consisted of five Tests, while Langer appeared in 35 Test series, with only two Ashes series consisting of five Tests, so that despite that large discrepancy in numbers of series Langer played in just twice the number of Tests in which Bradman appeared. And yet Bradman totalled almost as many impact points as Langer did, which is as you might guess because Bradman basically had twice the impact of Langer on a per-match basis. Bradman averaged over 20 impact points per match in seven of 11 series, whereas Langer did so in just four of 35, and two of those were single-Test series.
This example clearly illustrate the fact that the raw totals themselves should not be considered in isolation.
Golden Age of Bowling
Another issue which has been discussed by me at length is the high impact scores of early bowlers – this has to be taken into account otherwise our list is dominated by bowlers like Barnes, Tom Richardson, Charlie Turner, George Giffen, Fred Spofforth etc. – those players were great, but it seems unlikely that in the first 130-odd Tests we had five or six of the 20 greatest players of all time, and only 14 in the 2000-plus Tests since then.
Embarassment of Riches?
What is the effect of adding new Test teams? Does this inflate the numbers of those experienced players who get to feast on relatively naive Test-level batting and bowling? Presumably yes, but by how much? Certainly that was the case when Bangladesh was promoted before being totally ready for competitive Test cricket. South Africa was certainly the very definition of a minnow when first promoted, but quickly came up to speed. In any case, the relative strength of the opposition is taken into account, along with the aforementioned bowler adjustments, in the opposition-adjusted ratings shown below, which also addresses modern players playing more matches against higher quality opposition than in previous eras.
War – What is it Good For?
Another thing which could be considered was the case where a player didn’t play in the number of Tests which he should have; wartime is an obvious barrier to Test cricket, impacting for example Bradman, Hutton and Compton quite significantly – for example it’s possible Bradman would have played 25 additional Tests during the six years of WWII. Barnes I mentioned earlier, whose confrontational personality certainly cost him some Tests. Others, like Clarrie Grimmett, were denied a place due to the whims of other, more high-ranking, personnel. Or Harold Larwood, cast aside as the Bodyline scapegoat. In the end, it’s not possible to know exactly how many more Tests each player would have played in, or indeed if they would have been selected, so I left that one alone.
Heroes and Villains
There is also the issue of inspirational leadership, or its opposite, divisive personalities – in the former, Mike Brearley and Douglas Jardine might be considered worthy of additional credit, while conversely Kevin Pietersen might be considered as debit-worthy. Or particularly outstanding personalities with colossal import such as WG Grace – should he get extra credit, especially considering that he is not well represented by his performances in Tests, all of these coming after his heyday? Again, this is a subjective issue which I decided was not apporpriate for this exercise.
Ooh, My Aching Knees
What about fielding? The method I adopted to share impact for dismissals was a third each between batsman (which weighs negatively against his batting impact score for getting himself out), fielder (if any) and bowler – the split between the fielder and bowler which I chose is 50/50, but is this right? Should be it 40/60? 25/75? Should it be 50/50 between the batsman and fielder/bowler? I stuck with 33/33/33 for each of the batsman, fielder and bowler, because frankly it’s the only really objective way to handle it. Plus otherwise wicket keepers may be ranked unfairly low, especially considering their relatively shorter playing careers due to the physical difficulties of the position.
So Much Data
I have previously advocated incorporating the varying measures (e.g. 1500+ for total impact versus maybe 20.00 for per match average) into a geometric mean so as to preclude the aggregate value totally swamping the effect of the much lower magnitude per-match average. I must admit I was somewhat swayed by the final result, which showed the top-ranked player having a geometric mean of 0.9994 (do those numbers ring any bells?), but ultimately I can’t say for sure if the ranking is correct. I tried weighting, but of course then we’re getting into the subjective area which I try so hard to steer clear of.
I’d be interested to receive any comments from actual statisticians who might be reading who could suggest a robust method of combining the various measures to give a reasonable overall rating. Failing that, I’ll post the overall rating based on geometric mean at the end of the feature.
So how big is an elephant?
As noted in lat week’s feature, there are a number of ways to measure impact; total career aggregate, average per match, a moving five-Test average, amount of time and degree of exceeding a specific threshold, and all of the above for both raw and adjusted performances – these are described in more detail below. Following are several lists of players whose impact excelled by each of the above measures.
First, here are the aggregate and per-match numbers, based on unadjusted figures and those adjusted for opposition strength. What these show is an aggregate of all of the match impact percentages for each player, where each match percentage is made up of the impact on win probability of that player’s performances, such as run share in impactful partnerships, dismissal and wickets taken which negatively impact the batting team’s chances of winning and subsequently improve the bowling team’s chances. These are also shown as an average impact percentage per match. Adjusted figures take into account the strength of the opposition.
CAREER IMPACT – AGGREGATE (UNADJUSTED)
2713 – Sachin Tendulkar (Ind)
2524 – Jacques Kallis (SA)
2162 – Rahul Dravid (Ind)
2160 – Kumar Sangakkara (SL)
2129 – Ricky Ponting (Aus)
1998 – Muttiah Muralitharan (SL)
1991 – Shane Warne (Aus)
1911 – Sanath Jayawardene (SL)
1905 – Kapil Dev (Ind)
1833 – Garry Sobers (WI)
1827 – Shaun Pollock (SA)
1824 – Allan Border (Aus)
1806 – Anil Kumble (Ind)
1795 – Ian Botham (Eng)
1793 – Brian Lara (WI)
1773 – Sunil Gavaskar (Ind)
1756 – Graeme Smith (SA)
1695 – Richard Hadlee (NZ)
1658 – Steve Waugh (Aus)
1651 – Wasim Akram (Pak)
To a certain extent this list follows those who have played the most Tests, so it disadvantages those from earlier eras. Disappointing for me to see just one England player in the top 20, while Indian enjoys five players, and more pertinently, four Australians, though I’m glad to see all of the top eight Test nations represented – it would be unreasonable to expect to see players from Zimbabwe or Bangladesh, considering their relative lack of playing time compared to the others.
CAREER IMPACT – AVERAGE PER TEST (UNADJUSTED)
23.71 – SF Barnes (Eng)
21.29 – Don Bradman (Aus)
21.01 – Aubrey Faulkner (SA)
20.55 – Jack Gregory (Aus)
19.92 – Bill O’Reilly (Aus)
19.71 – Garry Sobers (WI)
19.70 – Richard Hadlee (NZ)
19.47 – Ravi Ashwin (Ind)
19.15 – Kane Williamson (NZ)
18.29 – Allan Davidson (Aus)
18.25 – Azhar Ali (Pak)
18.17 – Mohammad Hafeez (Pak)
17.98 – Trevor Goddard (SA)
17.85 – Kumar Sangakkara (SL)
17.79 – Tibby Cotter (Aus)
17.78 – Ian Botham (Eng)
17.73 – Jonathan Trott (Eng)
17.66 – Shakib Al Hasan (Ban)
17.61 – Dennis Lillee (Aus)
17.42 – Bobby Simpson (Aus)
Some surprises there, certainly. Barnes is some way ahead of Don Bradman and looks in a class of his own, impact-wise at least based on raw numbers. Despite the advantages I mentioned in the aggregates section, there are still a lot of modern players who rank highly on an average basis too. Good to see a Bangladesh player, Shakib Al Hasan, in the top 20 – nine nations now represented. I had to put in a minimum Tests threshold here, which I set at 20, and that excludes players such as Tom Richardson, who I make special mention of because his per-match average of 20.67 would have placed him fourth in the above list. Jack Hobbs is 21st, by the way, with Joe Root at 28th. Andy Flower is the highest-rated Zimbabwean at 15.01. It remains to be seen if current players such as Ashwin and Williamson can maintain their early pace over a full career.
CAREER IMPACT – AGGREGATE (ADJUSTED FOR OPPOSITION)
2845 – Sachin Tendulkar (Ind)
2648 – Jacques Kallis (SA)
2229 – Rahul Dravid (Ind)
2156 – Kumar Sangakkara (SL)
2208 – Ricky Ponting (Aus)
2097 – Shane Warne (Aus)
2047 – Muttiah Muralitharan (SL)
2006 – Kapil Dev (Ind)
1977 – Mahela Jayawardene (SL)
1942 – Garry Sobers (WI)
1935 – Brian Lara (WI)
1923 – Shaun Pollock (SA)
1915 – Allan Border (Aus)
1910 – Anil Kumble (Ind)
1851 – Ian Botham (Eng)
1840 – Sunil Gavaskar (Ind)
1782 – Graeme Smith (SA)
1743 – Richard Hadee (NZ)
1713 – Alec Stewart (Eng)
1704 – Steve Waugh (Aus)
Now that we’ve adjusted for strength of opposition, we see some movement of the incumbents as well as one new player in the top 20 – Alec Stewart. Tendulkar’s lead is about the same over Kallis when opponents are takend into account – Tendulkar’s average opponent rated 109 while Kallis’ was 107, and Brian Lara has moved from 15th up to 11th. Notably Shane Warne, after adjusting for performances against stronger opposition, moves ahead of Murali.
CAREER IMPACT – AVERAGE PER TEST (ADJUSTED FOR OPPOSITION STRENGTH)
22.91 – Sydney Barnes (Eng)
21.36 – Don Bradman (Aus)
20.89 – Garry Sobers (WI)
20.27 – Richard Hadlee (NZ)
20.24 – Ravi Ashwin (Ind)
20.05 – Bill O’Reilly (Aus)
19.89 – Alan Davidson (Aus)
19.84 – Trevor Goddard (SA)
19.73 – Aubrey Faulkner (SA)
19.62 – Jack Gregory (Aus)
18.71 – Kane Williamson (NZ)
18.70 – Dennis Lillee (Aus)
18.57 – Hugh Tayfield (SA)
18.50 – Bobby Simpson (Aus)
18.33 – Ian Botham (Eng)
18.04 – Tony Greig (Eng)
17.98 – Shaun Pollock (SA)
17.82 – Kumar Sangakkara (SL)
17.71 – Jonathan Trott (Eng)
17.70 – Azhar Ali (Pak)
To expand on the comment above regarding raising the game against quality opposition, we can restrict the rating to just matches against those better teams. The following lists are restricted to match impact in Tests against teams with an ICC rating of 100 or more; this will have an impact on the ratings if a player raised his game against quality opposition but not so much against minnows, and if he had a lower or higher percentage of opponents of strength or otherwise:-
CAREER IMPACT – AGGREGATE (ADJUSTED FOR QUALITY OPPOSITION)
2131 – Jacques Kallis (SA)
2098 – Sachin Tendulkar (Ind)
1815 – Brian Lara (WI)
1735 – Ricky Ponting (Aus)
1723 – Shane Warne (Aus)
1706 – Kapil Dev (Ind)
1621 – Shaun Pollock (SA)
1549 – Rahul Dravid (Ind)
1496 – Mahela Jayawardene (SL)
1466 – Allan Border (Aus)
1441 – Courtney Walsh (WI)
1439 – Anil Kumble (Ind)
1427 – Kumar Sangakkara (SL)
1390 – Sunil Gavaskar (Ind)
1385 – Garry Sobers (WI)
1377 – Ian Botham (Eng)
1351 – Muttiah Muralitharan (SL)
1350 – Alec Stewart (Eng)
1294 – Graeme Smith (SA)
1281 – Graham Gooch (Eng)
Kallis now moves slightly ahead of Tendulkar. Brian Lara shoots up to 3rd place by measuring only matches played against quality opposition – Lara faced such opponents in an astonishing 92% of all matches. Sangakkara and Murali fall significantly, while we lose Hadlee and Waugh, replaced by Courtney Walsh (at 11th) and Graham Gooch. On a per-Test basis, we have the following top 20:-
CAREER IMPACT – AVERAGE PER TEST (ADJUSTED FOR QUALITY OPPOSITION)
22.70 – Garry Sobers (WI)
22.20 – Alan Davidson (Aus)
21.46 – Don Bradman (Aus)
21.37 – Richard Hadlee (NZ)
20.70 – Ravi Ashwin (Ind)
20.56 – Hugh Tayfield (SA)
20.47 – Colin Bland (SA)
20.29 – Bill O’Reilly (Aus)
19.85 – Dennis Lillee (Aus)
19.66 – Eddie Barlow (SA)
19.59 – Colin Croft (WI)
19.32 – Imran Khan (Pak)
19.31 – Trevor Goddard (SA)
19.02 – Wasim Akram (Pak)
18.64 – Shaun Pollock (SA)
18.37 – Fazal Mahmood (Pak)
18.37 – Ian Botham (Eng)
18.23 – Fred Trueman (Eng)
18.03 – Alec Bedser (Eng)
18.02 – Tony Greig (Eng)
Barnes didn’t have enough matches against quality opposition, otherwise he would be top with 24.87. Nice to have a list with Colin Bland featured, illustrating both his gift for raising his game and the value of a rating system which also incorporates fielding. Also the great Imran Khan now joins the top-ranked players, as do Pakistani paceman Fazal Mahmood and some great England pace exponents, Fred Trueman and Alec Bedser. As I mentioned earlier, it remains to be seen if Ashwin can maintain this level for a full career.
Finally, I have advocated a moving average of match impact over five Tests to better identify peaks and troughs of performance (you can see this described in more detail and represented graphically here, where I compared the career profiles of Graham Gooch with David Gower and ted Dexter with Alastair Cook. Below are the MA5 averages, both undajusted and adjusted for opposition. I use two ways to assess this, a career peak MA5 value and the total number by which the 20% “true class” threshold was exceeded in total, the latter which I arbitrarily apply and make no apologies for.
PEAK MA5 (UNADJUSTED)
52.40 – Kumar Sangakkara (SL)
50.09 – Aubrey Faulkner (SA)
47.90 – Sachin Tendulkar (Ind)
45.85 – Walter Hammond (Eng)
43.25 – Ian Botham (Eng)
42.97 – Sydney Barnes (Eng)
41.70 – Mohammad Hafeez (Pak)
41.67 – Hugh Tayfield (SA)
41.24 – Bobby Simpson (Aus)
41.21 – Richard Hadlee (NZ)
41.17 – Fred Spofforth (Aus)
41.01 – Andrew Flintoff (Eng)
40.60 – Don Bradman (Aus)
40.40 – Garry Sobers (WI)
39.33 – Shriv Chanderpaul (WI)
37.58 – Bhagwat Chandrasekhar (Ind)
36.80 – Michael Clarke (Aus)
36.73 – Eddie Barlow (SA)
36.35 – Yasir Hameed
36.29 – Brian Lara (WI)
36.10 – Wasim Akram (Pak)
PEAK MA5 (ADJUSTED FOR OPPOSITION)
51.48 – Sachin Tendulkar (Ind)
48.32 – Andrew Flintoff (Eng)
48.20 – Hugh Tayfield (SA)
44.87 – Shriv Chanderpaul (WI)
44.13 – Garry Sobers (WI)
44.01 – Aubrey Faulkner (SA)
43.91 – Ian Botham (Eng)
43.69 – Walter Hammond (Eng)
42.11 – Mohammad Hafeez (Pak)
42.10 – Bobby Simpson (Aus)
41.98 – Brian Lara (WI)
41.85 – Richard Hadlee (NZ)
41.49 – Don Bradman (Aus)
40.45 – Bhagwat Chandrasekhar (Ind)
40.38 – Wasim Akram (Pak)
39.53 – Kumar Sagakkara (SL)
39.31 – Dominic Cork (Eng)
39.30 – Eddie Barlow (SA)
38.98 – Alan Davidson (Aus)
38.85 – Jacob Oram (NZ)
MA5 ABOVE 20% (UNADJUSTED)
347.6 – Garry Sobers (WI)
322.0 – Kumar Sangakkara (SL)
222.0 – Sachin Tendulkar (Ind)
215.3 – Richard Hadlee (NZ)
211.4 – Fred Spofforth (Eng)
209.0 – Ian Botham (Eng)
178.4 – Don Bradman (Aus)
176.7 – Jacques Kallis (SA)
169.2 – Walter Hammond (Eng)
166.1 – Younus Khan (Pak)
154.4 – Shaun Pollock (SA)
140.0 – Wasim Akram (Pak)
131.7 – Aubrey Faulkner (SA)
131.0 – Ricky Ponting (Aus)
125.2 – Daniel Vettori (NZ)
123.5 – Muttiah Muralitharan (SL)
122.9 – Bobby Simpson (Aus)
121.9 – Sydney Barnes (Eng)
121.4 – Viv Richards (WI)
120.1 – Tony Grieg (Eng)
A first appearance for Viv Richards there in our lists.
MA5 ABOVE 20% (ADJUSTED FOR OPPOSITION)
449.6 – Garry Sobers (WI)
298.2 – Kumar Sangakkara (SL)
282.6 – Sachin Tendulkar (Ind)
241.5 – Ian Botham (Eng)
235.9 – Jacques Kallis (SA)
235.0 – Richard Hadlee (NZ)
205.6 – Shaun Pollock (SA)
188.8 – Don Bradman (Aus)
179.4 – Alan Davidson (Aus)
179.2 – Wasim Akram (Pak)
176.1 – Fred Spofforth (Aus)
161.9 – Andrew Flintoff (Eng)
160.5 – Younus Khan (Pak)
159.6 – Tony Grieg (Eng)
159.2 – Shriv Chanderpaul (WI)
154.5 – Ricky Ponting (Aus)
153.9 – Virender Sehwag (Ind)
150.3 – Bobby Simpson (Aus)
149.8 – Muttiah Muralitharan (SL)
139.7 – Hugh Tayfield (SA)
MA5 ABOVE 20% PER TEST (UNADJUSTED)
5.27 – Aubrey Faulkner (SA)
4.69 – Sydney Barnes (Eng)
3.74 – Garry Sobers (WI)
3.50 – Don Bradman (Aus)
3.19 – Jack Gregory (Aus)
2.73 – Hugh Tayfield (SA)
2.72 – Alan Davidson (Aus)
2.66 – Kumar Sangakkara (SL)
2.50 – Richard Hadlee (NZ)
2.47 – George Ulyett (Eng)
2.39 – Peter Pollock (SA)
2.35 – Bill O’Reilly (Aus)
2.12 – Shakib Al Hasan (Ban)
2.11 – Kane Williamson (NZ)
2.07 – Tony Greig (Eng)
2.07 – Ian Botham (Eng)
2.01 – Walter Hammond (Eng)
1.98 – Bobby Simpson (Aus)
1.82 – Eddie Barlow (SA)
1.81 – Warwick Armstrong (Aus)
Special mention for Spofforth and Tom Richardson who didn’t meet my match total cut-off but would have led this list if they qualified (11.75 and 7.83 respectively).
MA5 ABOVE 20% PER TEST (ADJUSTED FOR OPPOSITION)
4.83 – Garry Sobers (WI)
4.29 – Sydney Barnes (Eng)
4.08 – Alan Davidson (Aus)
3.99 – Aubrey Faulkner (SA)
3.78 – Hugh Tayfield (SA)
3.70 – Don Bradman (Aus)
2.78 – George Ulyett (Eng)
2.75 – Tony Greig (Eng)
2.73 – Richard Hadlee (NZ)
2.53 – Bill O’Reilly (Aus)
2.49 – Jack Gregory (Aus)
2.46 – Kumar Sangakkara (SL)
2.42 – Bobby Simpson (Aus)
2.39 – Ian Botham (Eng)
2.38 – Eddie Barlow (SA)
2.14 – Trevor Goddard (SA)
2.08 – Andrew Flintoff (Eng)
2.04 – Saqlain Mushtaq (Pak)
1.92 – Shaun Pollock (SA)
1.88 – George Hirst (Eng)
Again Spofforth (9.78) and Richardson (6.77) would have led this list if they qualified , and nice to see Kirkheaton’s best or second-best all-rounder, depending on your point of view.
Put it together and what have you got?
I had proposed that the geometric mean was the best method to summarize the various match impact measures such that the large career aggregate values (in the thousands) did not dwarf the averages and peak values (in the tens). As I’m not a statistics professional I don’t honestly know if the geometric mean is a reasonable representation of the data based on my concerns above, but anyway below are the top 20 players ranked by comparing the geometric means of all of their career impact values as represented above, both in aggregate and as averages; note that this is raw data without any adjustments for strength of opposition:-
ALL-TIME BEST IMPACT TEST PLAYERS – GEOMETRIC MEAN, UNADJUSTED
20 – Hugh Tayfield (SA)
19 – Muttiah Muralitharan (SL)
18 – Tony Greig (Eng)
17 – Alan Davidson (Aus)
16 – Tom Richardson (Eng)
15 – Bobby Simpson (Aus)
14 – Wasim Akram (Pak)
13 – Jacques Kallis (SA)
12 – Shaun Pollock (SA)
11 – Younus Khan (Pak)
10 – Sydney Barnes (Eng)
9 – Walter Hammond (Eng)
8 – Aubrey Faulkner (SA)
7 – Sachin Tendulkar (Ind)
6 – Don Bradman (Aus)
5 – Ian Botham (Eng)
4 – Fred Spofforth (Aus)
3 – Richard Hadlee (NZ)
2 – Kumar Sangakkara (SL)
1 – Garry Sobers (WI)
Points to note: Bradman is not number one, based on unadjusted match impact percentage data. Nor is he number two, three, four or five, for that matter, though he is the top-ranked pure batsman, just ahead of Tendulkar and considering Sangakkara as a batsman-wicket keeper. And this is the whole point – because we now have a basis for direct comparison, we can show that there are five other players whose combined impact exceeds Bradman’s with the bat. I was very surprised Sangakkara ranked two overall, but this is because previously we haven’t been able to compare players using a full compliment of their skills on an equal footing (or level playing field, if you prefer). The above list comprises three pure batsmen, five batting all-rounders, four bowling all-rounders, two spinners, four pace bowlers, a batsman-wicket keeper and Aubrey Faulkner, who I couldn’t really categorise except as a balanced all-rounder. Nations represented include four Australians, five England players, one Indian, one New Zealander, two Pakistanis, four South Africans, two Sri Lankans and one West Indian, the latter a surprise as I’d expected more.
The above list suffers from a surfeit of early bowlers, which as I mentioned in the previous article is a result of how bowlers were used back then and directly influences their relative opportunity as compared to modern bowlers. The adjusted list below takes this into account, as well as adjusting for strength of opposition based on my previous work rating all of the Test sides back to 1877.
ALL-TIME BEST IMPACT TEST PLAYERS – GEOMETRIC MEAN, ADJUSTED
20 – Virender Sehwag (Ind)
19 – Walter Hamond (Eng)
18 – Muttiah Muralitharan (SL)
17 – Sydney Barnes (Eng)
16 – Younus Khan (Pak)
15 – Tony Greig (Eng)
14 – Andrew Flintoff (Eng)
13 – Hugh Tayfield (SA)
12 – Bobby Simpson (Aus)
11 – Fred Spofforth (Aus)
10 – Wasim Akram (Pak)
9 – Shaun Pollock (SA)
8 – Jacques Kallis (SA)
7 – Alan Davidson (Aus)
6 – Don Bradman (Aus)
5 – Ian Botham (Eng)
4 – Sachin Tendulkar (Ind)
3 – Richard Hadlee (NZ)
2 – Kumar Sangakkara (SL)
1 – Garry Sobers (WI)
Points to note: We’ve gained one Indian (Sehwag) and an England player (Flintoff), the early bowlers have dropped significantly, and Tendulkar has moved slightly ahead of Bradman due to the generaly higher level of competition faced by the Indian icon.
Based on the geometric mean, then, Garry Sobers shows as the most impactful Test player of all time, whether we use raw numbers or rate players when adjusted for opposition. However, my reticence to countenance this method is based on the fact that I just don’t know how valid it is – does it unduly favour those with a long career, or those who played a handful of matches but performed to a high level?
Therefore I’ve done something which I’ve never done before, that is I’ve produced my own ranking, based on a weighted average of the various measures referenced in the previous feature. These include the career total impact, average per match, value of Tests where the moving five-Test average was higher than the 20% “greatness” threshold, the best consecutive five Tests, where all of the previous were derived for both unadjusted and adjusted for the strength of opposition. The reason I refrain from such frivolity is that any weighting is subjective, and I always try to make my work completely objective.
First, here is my ranking based on raw, unadjusted data (the accompanying numbers show career impact percentage aggregate, average per Test, total value over 20%, peak value over five consecutive Tests, and value over 20% on a per Test basis, though I’ve taken into account more figures than these in my rating):-
ALL-TIME BEST IMPACT TEST PLAYERS – WEIGHTED AVERAGE, UNADJUSTED
20 – Imran Khan (Pak) [1420, 16.32, 48.34, 26.82, 0.56]
19 – Jack Hobbs (Eng) [1026, 17.38, 89.11, 29.00, 1.51]
18 – Malcolm Marshall (WI) [1130, 13.94, 48.77, 30.98, 0.60]
17 – Wasim Akram (Pak) [1651, 16.51,139.98, 36.10, 1.40]
16 – Walter Hammond (Eng) [1412, 16.81, 169.19, 45.84, 2.01]
15 – Dennis Lillee (Aus) [1180, 17.61, 64.61, 33.35, 0.96]
14 – Ricky Ponting (Aus) [2129, 12.67, 131.02, 31.57, 0.78]
13 – Viv Richards (WI) [1432, 12.03, 121.37, 33.16, 1.02]
12 – Shane Warne (Aus) [1991, 13.82, 49.50, 29.83, 0.34]
11 – Brian Lara (WI) [1793, 13.90, 93.59, 36.39, 0.73]
10 – Muttiah Muralitharan (SL) [1998, 15.25, 123.47, 35.95, 0.94]
9 – Tom Richardson (Eng) [289, 20.67, 109.66, 36.76, 7.83]
8 – Aubrey Faulkner (SA) [525, 21.01, 131.65, 50.09, 5.27]
7 – Fred Spofforth (Aus) [331, 18.38, 211.43, 41.17, 11.75]
6 – Ian Botham (Eng) [1795, 17.78, 208.97, 43.25, 2.07]
5 – Richard Hadlee (NZ) [1695, 19.70, 215.31, 41.21, 2.50]
4 – Sachin Tendulkar (Ind) [2713, 13.91, 222.03, 47.90, 1.14]
3 – Don Bradman (Aus) [1086, 21.29, 178.42, 40.60, 3.50]
2 – Garry Sobers (WI) [1833, 19.71, 347.56, 40.40, 3.74]
1 – Sydney Barnes (Eng) [617, 23.71, 121.87, 42.97, 4.69]
That’s six batsmen, eight bowlers (including two spinners) and six all-rounders. Again the above list is peppered with early bowlers, so the next list weights the various measures but with adjustments on early bowlers based on increased opportunity and for opposition strength:-
ALL-TIME BEST IMPACT TEST PLAYERS – WEIGHTED AVERAGE, ADJUSTED
20 – Viv Richards (WI) [1475, 12.39, 139.58, 35.98, 1.17]
19 – Kapil Dev (Ind) [2006, 15.55, 107.18, 34.56, 0.83]
18 – Ricky Ponting (Aus) [2208, 13.14, 154.54, 33.09, 0.92]
17 – Imran Khan (Pak) [1493, 17.17, 84.66, 27.75, 0.97]
16 – Bill O’Reilly (Aus) [541, 20.05, 68.34, 32.19, 2.53]
15 – Alan Davidson (Aus) [875, 19.89, 179.38, 38.98, 4.08]
14 – Kumar Sangakkara (SL) [2156, 17.82, 283.80, 39.53, 2.35]
13 – Dennis Lille (Aus) [1253, 18.70, 88.20, 34.66, 1.32]
12 – Wasim Akram (Pak) [1696, 16.96, 179.15, 40.38, 1.79]
11 – Jacques Kallis (SA) [2648, 15.95, 235.86, 33.73, 1.42]
10 – Muttiah Muralitharan (SL) [2047, 15.62, 149.84, 36.81, 1.14]
9 – Shaun Pollock (SA) [1923, 17.98, 205.64, 34.72, 1.92]
8 – Shane Warne (Aus) [2097, 14.56, 80.13, 31.77, 0.56]
7 – Ian Botham (Eng) [1851, 18.33, 241.50, 43.91, 2.39]
6 – Brian Lara (WI) [1935, 15.00, 136.18, 41.98. 1.06]
5 – Sachin Tendulkar (Ind) [2845, 14.59, 282.57, 51.48, 1.45]
4 – Don Bradman (Aus) [1089, 21.36, 188.83, 41.49, 3.70]
3 – Richard Hadlee (NZ) [1743, 20.27, 235.04, 41.85, 2.73]
2 – Sydney Barnes (Eng) [596, 22.91, 111.55, 35.49, 4.29]
1 – Garry Sobers (WI) [1943, 20.89, 449.61, 44.13, 4.83]
That’s five batsmen, six bowlers (three spin, three pace) eight all-rounders and one batsman-wicket keeper. More than half of the above favour bowling as their chief skill, which supports my original proposition that we can’t adequately rate players when considering their skills in isolation. Bradman is now third all time when opposition performance is factored in, behind Sobers and Barnes. I didn’t expect Barnes to be this high based on adjusted numbers given that he took lots of wickets against weak South African sides, however clearly he also performed well against better Australian sides too. Other points to note: Warne, who had ranked slightly behind Murali based on raw data, again moves ahead of the Sri Lankan when performance against stronger opposition is taken into account. Lara moves up to 6th and we now have three West Indians in the top 20, as Viv Richards joins Lara and Sobers. Spofforth, Richardson and Faulkner all drop out, chiefly as a result of the adjustment to their bowling figures.
Hammond drops out of the top 20, despite no downward bowling adjustment, because less than half of his opponents were rated higher than my “quality” threshold, i.e. an ICC rating of 100. Same with Jack Hobbs. Jacques Kallis moves into the adjusted top 20, as does Kapil Dev. That gives us a more balanced look from a countries perspective, however the adjusted list is significantly dominated by Australians, with six; West Indies has three players, and all others have two except New Zelanad, solely represented by Richard Hadlee. England drops from five players to two in the adjusted list. Bangladesh and Zimbabwe players do feature in the top 100, notably Monimul Haque and Shakib Al Hasan, and Andy Flower and Paul Strang respectively.
Out of interest I’ve posted the career profiles of Sobers and Bradman graphically below.
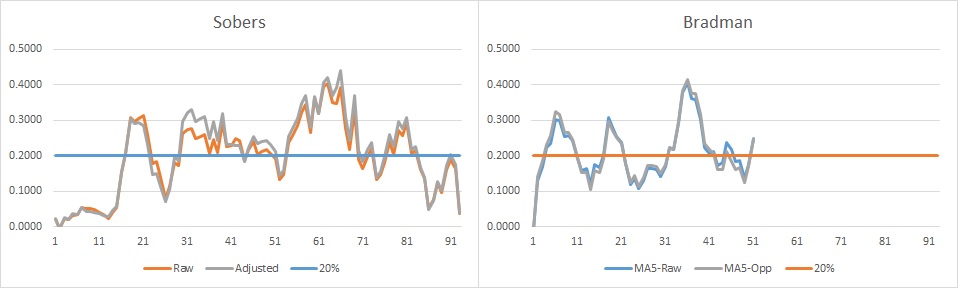
So there you have it – from a purely impact perspective, three players rank ahead of the great Don Bradman; Richard Hadlee, Sydney Barnes and the incomparable Garfield Sobers, impact player extraordinaire.


Leave a comment