Four All-Rounders – a Study in Impact
Dave Wilson |Recently Gareth concluded his review of the four all-rounders’ performances against the great West Indies teams. Though Gareth’s study was restricted to the mighty Caribbean teams of the eighties and nineties, I decided to look at their whole careers from an impact point of view.
There has been much discussion on the site forums regarding the various attributes of Imran Khan, Richard Hadlee, Ian Botham and Kapil Dev, culminating in the noted CW50, where forum members voted for the all-time greatest cricketers. In that poll, Kapil Dev came in at number 35, Ian Botham at 20, Hadlee at number 10, with Imran ranking highest at number 6. A second poll a little while later saw all four rated higher though still in the same order, but with Imran now ranked at number three all-time, behind only Sobers and Bradman. Hadlee himself stated that he felt Imran was the best of the four, though whether or not he would ever have immodestly claimed himself to be the best is up for question.
So certainly the CW cognoscenti consider that Imran was the greatest of the four. It’s possible that Imran’s prowess as captain and his undoubted charisma factored in to this high ranking, though it’s difficult to be sure on that, or for that matter how Botham’s rating was impacted by his philanthropic activities or his recent career in punditry.
The man whom many consider to be the greatest all-rounder of them all (and according to CW’s most recent poll, the greatest cricketer ever), Garry Sobers, discussed the four in his 2002 autobiography. Rather surprisingly, he felt that Hadlee was the least impressive of the four, comparing him more closely to Malcolm Marshall, though he did qualify that by writing that Hadlee at least deserved to be in the discussion with the other three.
In terms of traditional aggregate statistics, Kapil Dev leads the way in both runs scored and wickets taken, though he played in almost 50 more Tests than Hadlee and Imran, indeed Hadlee is only three wickets behind Kapil Dev’s total. Additionally, Botham is just 48 runs shy of Dev in 29 fewer Tests.
When we look at averages, Imran certainly looks to deserve his CW ranking – he has the highest batting average and is only a little shy of Hadlee’s average in bowling. While I don’t necessarily approve of the traditional method of assessing all-rounders, i.e. batting average less bowling average, using this method Imran is miles ahead at 14.88, Botham being next best on 5.14.
Looking now at career impact, the aggregate numbers look like this:-
| PLAYER | TOT IMP |
| Dev | 2107 |
| Botham | 1907 |
| Hadlee | 1738 |
| Imran | 1567 |
On a per-Test basis, the players rank as follows:-
| PLAYER | AVG IMP |
| Hadlee | 20.20 |
| Botham | 18.89 |
| Imran | 18.01 |
| Dev | 16.33 |
Dev has slipped from first to fourth, while Hadlee is top-ranked. The above figures show career impact for each discipline combined, something that we can’t do with traditional statistics which must be considered separately. Though it goes against what I’m trying to do here, it’s nontheless instructive to look at each players impact contribution by discipline; these break down as follows (percentages in parenthese):-
| PLAYER | BT(%) | FLD(%) | BW(%) |
| Imran | 542(34.6) | 32(2.0) | 993(63.4) |
| Hadlee | 432(24.9) | 70(4.0) | 1236(71.1) |
| Botham | 577(30.3) | 240(12.5) | 1090(57.2) |
| Dev) | 765(36.3 | 105(5.0 | 1237(58.7) |
These figures show objectively what we largely know to be true – Botham, fielding in the slips, was by far the most impactful fielder, Imran the least; Hadlee was significantly higher in terms of impact contributed by bowling, significantly lower in batting. Though all four had less impact batting than bowling, Kapil Dev has the highest impact of the four for batting, which I did not expect.
As I’ve mentioned in previous articles, aggregates and averages tell only part of the story; for example, the performance of both Dev and Botham tailed off significantly towards the end of their careers, while Imran and Hadlee retired very much still at the height of their powers. A fast start, such as Botham enjoyed, can mask up and down performances later on, while the opposite applies for slow starters, like Sobers for example.
The variations in each player’s impact throughout their careers is represented graphically below – the impact profiles for each player are shown, based on a five-Test rolling average to show the peaks and troughs of their performances. The overall per-Test average impact throughout Test cricket history comes out at about 10%, so in these profiles I’ve included a line at twice that value, i.e. 20% to show how far above that level these cricketers maintained their peak impact averages.
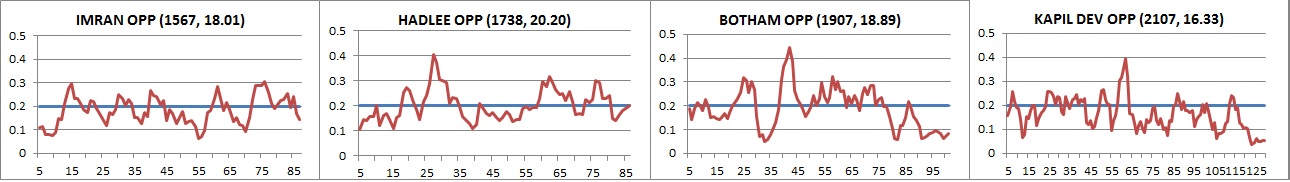
Click to Enlarge Image
At first glance, we see that Botham had the highest peak, with Hadlee and Dev slightly lower but around the same value, and Imran with the lowest peak. But we can also see Imran’s remarkable consistency – Imran had peaks around 30 or thereabouts for a duration of more than 60 Tests, which none of the others can match, though Hadlee and Botham come closest. To put that in perspective and to show how great these players were, Steve Waugh was able to maintain that level for a dozen Tests.
We can also see in stark detail Botham’s nadir prior to the relief of having captaincy wrested from him in 1981; in nine tests prior to Headingley he averaged just 7.5% impact per match, while his amazing performances at Headingley, Edgbaston and Old Trafford saw him average a massive 53% per Test. This change in fortunes saw his five-Test rolling average climb from 4.8 to 44.6.
Speaking of Botham, it’s interesting to compare his impact profile with the ICC all-rounder ratings profile. I plotted these on the same axes, scaling them so that the start and end points were identical thus allowing us to see the relative peaks and troughs. The ICC ratings show Botham as having peaked at the time of his admittedly monumental performance in the one-off Test against India in 1980, becoming the first to score a century and take 13 wickets in a single Test. These same ratings also show Botham going into steady decline from around half-way through his career.
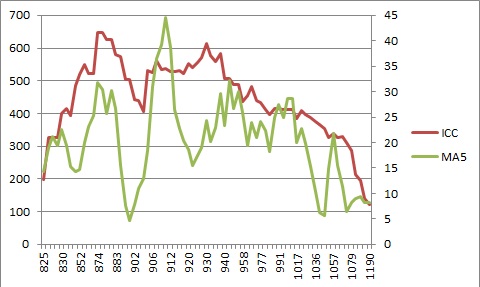
Botham’s impact profile however (labeled MA5 for 5-Test moving average), shows his peak occurring at the time of his legendary performances during the 1981 Ashes series. They also show that his decline began much later in his career; for his first 87 Tests he maintained an impact average per match of more than 20%, but for his last 15 less than 8%.
Though I don’t know exactly how the ICC calculates the algorithm on which their ratings are based, I do know that they are based purely on the information provided by the scorecards. As an example of how this can deviate significantly from the impact measure, take the Ashes Test at the MCG in 1982. This match was described by Wisden as “to be ranked among the best ever played, produced a finish of such protracted excitement that it had the whole of Australia by the ears.” Resuming on the final day at 255 for nine, Australia required another 37 runs to win, though considering that Allan Border was still at the crease they surely had a chance, and indeed Wisden notes that he was never in trouble. With just four runs left Australia were by now favoured, but then Botham had Thomson caught to give England a remarkable three-run victory, in the process becoming just the second England player, after the great Wilfred Rhodes, to notch 1,000 runs and 100 wickets in Ashes contests. That final wicket counts the same as every other wicket as far as the scorecard is concerned, but in terms of impact it was hugely significant. So in Botham’s impact profile we see an increase in his rolling average at that time, whereas his ICC profile continues its steady decline.
Back to the profiles of the four all-rounders. The table below shows the percentage of Tests played for which a particular five-Test rolling average was maintained, at thresholds of 10%, 15%, 20% and 30%:-
| PLAYER | 10% | 15% | 20% | 30% |
| Imran | 90.8% | 66.7% | 39.1% | 1.1% |
| Hadlee | 100.0% | 75.9% | 43.5% | 6.9% |
| Botham | 81.2% | 63.7% | 39.6% | 9.9% |
| Dev | 85.9% | 53.4% | 29.7% | 3.9% |
Hadlee and Imran show as much more consistent than the more mercurial Botham, though the latter has more Tests averaging over 30% than the others. The fact that Hadlee averaged more than 10% over his whole career is remarkable; by comparison, Sobers did not reach a 10% rolling average until after 15 Tests, though he managed to maintain that level for 73 of the next 74 Tests – even then, that is not quite up to Hadlee’s level of consistency.
As regards impact in individual matches, we can also look at milestones achieved, namely 30%, 40% and 50% in single-game impact, as well as looking at ‘failures”, which I’ve tagged at 5%, i.e. half of the average match impact (percentages in parentheses):-
| PLAYER | >30(%) | >40(%) | >50(%) | <5(%) | No 5s |
| Imran | 18(20.5) | 6(6.8) | 2(2.3) | 18(20.5) | 18 |
| Hadlee | 16(18.6) | 9(10.5) | 4(4.7) | 10(11.4) | 36 |
| Botham | 22(21.6) | 9(8.8) | 5(4.9) | 19(18.6) | 15 |
| Dev | 19(14.5) | 11(8.4) | 6(4.6) | 19(22.1) | 11 |
Kapil Dev is quite a bit lower then the others in terms of total matches with more than 30% of impact, and he also ranks fourth in terms of failures. In terms of massive impact matches though, i.e. over 50%, he ranks highest with six, though around the same as Hadlee and Botham as a percentage of Tests played. The final column shows the longest sequence of Tests with no failures, or games of less than 5% impact – here, Hadlee is absolutely on his own, his sequence of 36 Tests being more than double than of the next man, Imran.
Measurement of impact in this way allows us to compare players on an equal footing across all disciplines, and with adjustments being made for strength of opposition. It also enables us to objectively assess the impact of relstive batting and bowling performances, and I must admit to be being hugely impressed with Hadlee’s numbers in this study. Having said that, there are areas of each of the player’s performances which are impressive, such as Kapil Dev’s batting impact, Botham’s high peak, and the consistency of both Imran and Hadlee.
I’m not going to nominate a winner here; it seems counter-productive to reel off objective data only to subjectively weight it and then rank the players, though any readers may choose to do so based on the above information.
To conclude, I’d like to emulate Gareth and look at only performances against the best team of their time, the all-conquering West Indies. The impact totals and average per Test are as follows:-
| PLAYER | TESTS | TOT IMP | AVG IMP |
| Imran | 18 | 502 | 27.88 |
| Hadlee | 10 | 242 | 24.23 |
| Dev | 25 | 569 | 22.76 |
| Botham | 19 | 325 | 17.09 |
Now we see what the CW voters saw – Imran Khan raised his game when it mattered most, against the best team of his time.
Which is, after all, a measure of true greatness.


interesting feature chasingthedon. Interesting analysis. I must say though that I was wondering about a few tables especially the one below this statement and the table after this as well.
[QUOTE]Back to the profiles of the four all-rounders. The table below shows the percentge of Tests played for which a particular average was maintained, at thresholds of 10%, 15%, 20% and 30%:[/QUOTE]
What does this mean? What particular average is this?
Comment by smalishah84 | 12:00am GMT 25 November 2014
Thanks for reading mate. I’m referring to the rolling five Test average that the impact profiles are based on.
Comment by Dave Wilson | 12:00am GMT 25 November 2014