Pitting Don Bradman Against Leaders of Related Sports: An Investigation – Part 3
Peter Kettle |
Pitting Don Bradman Against Leaders of Related Sports:
An Investigation
Part III
Bradman conversing with baseball legend Babe Ruth,
Yankee Stadium New York, July 1932
North American Sports
Turning to the four North American sports covered, international tournaments are held for baseball (World Classic from 2006, and World Cup during 1938-2011), basketball (FIBA World Cup from 1950) and American (or Gridiron) Football (IFAF World Championship from 1999), each being staged every four years; and also for ice hockey (World Championships, in full swing by 1930) being staged annually. All these feature national teams.
These sports are examined in a North American context because its leagues are of high quality and readily accessible performance data bases exist for individuals that extend far back. Indeed, these domestic leagues are distinctly superior in standard of play to the counterpart leagues in other countries, and are equivalent to international competition in the other sports considered. Also, there is extensive participation by league teams in these sports, reflecting their popularity and the large population base of the USA. (Canada is a minor participant for three of them and is excluded from one.)
A feature of the published statistics for these sports is that performance is reported chiefly for the standard (or regular) season, as used here; although they do exist for the subsequent playoff series as well. This has the merit of comparing strictly like-for-like, as many players never make the playoffs and some do so far more than others.
In playoffs, it is to be expected that facing tougher than usual opponents will result in a lower than overall regular season performance for individual players. The more prominent scorers tend to be around 5% to 15% down on performance stats per game for these sports, though this translates to only a small reduction when both phases of a season are combined – working out at around 0.5% to 2.0% down on a standard season alone.
Major League Baseball (MLB) – North America
The MLB has two separate competitions: the National League with 15 teams, formed in 1876; and the American League also with 15 teams, formed in 1901. There is currently only one Canadian team, being the Toronto Blue Jays. The season extends over some six months, usually consisting of 162 games per team.
Only from the 1990s onwards have schemes come into existence that rate a player’s demonstrated value to their team, so here reliance is placed on a long established measure of a batter’s success at the receiving plate: the “batting average”, obtained by dividing a player’s “hits” by his total “at bats”. A legitimate hit is one that puts the ball into play (termed “fair territory”) and is credited to the batter when he safely reaches or passes first base. An “at bat” is a player’s turn batting against a pitcher. The resulting batting average can, in principle, range anywhere between zero and 1.000.
Analysis is made of the leading 300 batting averages for those players with a minimum of 3,000 plate appearances (the number of times a turn at batting is completed).
Kettle – findings for baseball, top 12 to end 2020
| Career Span | Games | Batting Average | Z Score | ||
| 1 | Ty Cobb | 1905-28 | 3,035 | 0.3662 | 4.19 |
| 2 | Rogers Hornsby | 1915-37 | 2,259 | 0.3585 | 3.63 |
| 3 | Shoeless Joe Jackson | 1908-20 | 1,332 | 0.3558 | 3.43 |
| 4 | Lefty O’Doul | 1919-34 | 970 | 0.3493 | 2.96 |
| 5 | Ed Delahanty | 1888-1903 | 1,837 | 0.3458 | 2.70 |
| 6 | Tris Speaker | 1907-28 | 2,789 | 0.3447 | 2.62 |
| 7= | Billy Hamilton | 1888-1901 | 1,594 | 0.3444 | 2.60 |
| Ted Williams | 1939-60 | 2,292 | 0.3444 | 2.60 | |
| 9 | Dan Brouthers | 1879-1904 | 1,676 | 0.3424 | 2.45 |
| 10 | Babe Ruth | 1914-35 | 2,504 | 0.3421 | 2.43 |
| 11 | Dave Orr | 1883-90 | 791 | 0.3420 | 2.42 |
| 12 | Harry Heilmann | 1914-32 | 2,147 | 0.3416 | 2.39 |
Source: Baseball-Reference.com – Career Leaders & Records for Batting Average
A feature of the list is that all except one player have careers prior to WW2, which seems to indicate an inherent decline in batting averages (without the rules and regulations of the sport making batting significantly more difficult). Stephen Jay Gould – a biologist who produced a celebrated paper in 1986 on the historical development of the game – concluded that the very best hitters in modern times are just as good technically as those who, fairly commonly before the mid-1940s, used to manage to average a daunting batting average of 0.400 and higher in some seasons, even though recent generations have not been able to achieve this feat. The main reason being that the general increase in pitching and fielding standards has denied them nearly as many opportunities to score.[i]
The National Football League (NFL) – USA
The League began as the American Professional Football Association in 1920, renaming itself as the NFL from the 1922 season. A merger with the American Football League was finalised in 1970. The competition is confined to USA-based teams.
The standard season runs from early-September to early-January, each team playing 16 games, after which a play-offs tournament is held. As with a number of other sports, rating schemes have been devised to take account of all forms of ability, such as the “Pro Football Focus” scheme (as from 2006) and that of “Football Outsiders” (as from 2003), but that for the performance of quarterbacks – the individual who leads a team’s offensive play – extends sufficiently far back.
The traditional “passer rating” scheme is used here which is based on four metrics: yards per passing attempt, percentage of passing completions, interception percentage and touchdown percentage. Quarterbacks are judged by their how effective their passing is, based on four indicators: passing accuracy – the number of attempted passes being successfully caught by the receiver (“percentage of completions”); the number of touchdowns resulting from attempted passes (“percentage of touchdowns”); the number of attempted passes that result in an interception by the opposition (“interception percentage”), and number of yards gained per passing attempt – which includes yards made by the receiver after catching the ball (a reward for spotting the receiver’s opportunity). A complicated combination of these factors is used as the NFL’s official measure of quarterback performance.
(A receiver makes a touchdown, and hence earns points for the team, by carrying the ball across the opposition’s goal line or if he is already across the goal line on catching the ball and proceeds to touch down.)
It is noted that these statistics do not reflect leadership, play-calling, and other less tangible factors that go to make a successful quarterback.
Analysis was made of a field of 199 players, all having a minimum of 1,500 career passing attempts and a career rating of 52.0 and over.
Kettle – findings for American football, top 12 to end 2020
| Career Span | Games | Rating | Z Score | ||
| 1 | Patrick Mahomes | 2017 – | 46 | 108.7 | 3.07 |
| 2 | Deshaun Watson | 2017 – | 54 | 104.5 | 2.65 |
| 3 | Aaron Rodgers | 2005-20 | 197 | 103.9 | 2.59 |
| 4 | Russell Wilson | 2012-20 | 144 | 101.7 | 2.37 |
| 5 | Drew Brees | 2001-20 | 287 | 98.7 | 2.07 |
| 6 | Kirk Cousins | 2012 – | 109 | 97.9 | 1.98 |
| 7= | Tom Brady | 2000 – | 301 | 97.3 | 1.92 |
| Dak Prescott | 2016 – | 69 | 97.3 | 1.92 | |
| 9 | Tony Romo | 2004-16 | 150 | 97.1 | 1.90 |
| 10 | Steve Young | 1985-99 | 169 | 96.8 | 1.87 |
| 11 | Peyton Manning | 1998-2015 | 266 | 96.5 | 1.84 |
| 12 | Philip Rivers | 2004-20 | 244 | 95.2 | 1.71 |
Source: Pro-Football-Reference.com/NFL Passer Rating Career Leaders
Most notable is the very strong presence of recent players in the list, a trait which continues among the top 36. This is partly due to the passer rating scheme having some drawbacks, one being use of the percentage of completions statistic. Many contemporary quarterbacks surpass a number of all-time greats on this scheme because they are rewarded for “dink and dunk” completions. These are short passes – described as “quick flat, drag, hitch or corner routes that typically go for less than ten yards”. Among some elite omissions from the above top 12 are Joe Montana (1979-94) who is placed 16th and Dan Marino (1983-99) who is placed well down at 38th spot.
A scheme known as “total quarterback rating”, launched in 2011 and intended as a more complete alternative, is based on analysis of each and every play a quarterback is involved in. However, this is a highly complex assessment and has come in for criticism from a number of respected commentators. (The highest dominance rating under this scheme, on a best season basis, is 2.44 for Tom Brady, 2006 season.)
National Basketball Association/American Basketball Association (NBA/ABA)
The NBA was formed through merger in 1949 of the Basketball Association of America (established in 1946) and the National Basketball League (established in 1937). Nine years after the ABA was founded, the NBA and ABA formally merged in 1976 – effectively an NBA expansion as it took on four of the remaining six ABA teams, the other two folding. Currently, all the teams except one are USA- based, the Canadian team competing being the Toronto Raptors.
With each team fielding five players on the court, all positions are significantly engaged in attempting to put the ball through the hoop and hence score points for their team. Points can be accumulated by making field goals (two or three points) or free throws due to an opponent’s foul (one point).
A field of the leading 250 players was analysed – all with a minimum of 5,000 points in the former ABA, or with either 10,000 points or 400 games in the NBA – displaying a broad spread of careers.
Kettle – findings for basketball, top 12 to end 2020
| Career Span | Games | Points/Game | Z Score | ||
| 1 | Michael Jordan | 1984-2003 | 1,072 | 30.12 | 3.90 |
| 2 | Wilt Chamberlain | 1958-73 | 1,045 | 30.07 | 3.88 |
| 3 | Elgin Baylor | 1958-71 | 846 | 27.36 | 2.94 |
| 4 | Kevin Durant | 2007-20 | 849 | 27.06 | 2.84 |
| 5 | LeBron James | 2003-20 | 1,265 | 27.04 | 2.83 |
| 6 | Jerry West | 1960-74 | 932 | 27.03 | 2.82 |
| 7 | Allen Iverson | 1996-2010 | 914 | 26.66 | 2.70 |
| 8 | Bob Pettit | 1954-65 | 792 | 26.36 | 2.59 |
| 9 | Oscar Robertson | 1960-74 | 1,040 | 25.68 | 2.36 |
| 10 | James Harden | 2009-20 | 841 | 25.17 | 2.18 |
| 11 | George Gervin | 1972-86 | 1,060 | 25.09 | 2.15 |
| 12 | Karl Malone | 1985-2004 | 1,476 | 25.02 | 2.13 |
Source – Basketball-Reference.com/NBA & ABA Career Leaders and Records for Points per Game
North American Ice Hockey – National Hockey League (NHL)
Formed in 1917 by four Canadian teams, with the first USA team joining in 1924, the NHL had only two additional teams by 1967. This increased to 21 teams by 1979 and 30 by year 2000. There are currently 31 teams, seven of which are Canadian. The regular season consists of 82 games per team, running from early-October to early-April. The teams are organised into two geographically-based Conferences (Eastern and Western), each being split into two divisions.
The NHL is considered to be the world’s premier professional ice hockey league. Its players are now drawn from around 20 countries. Historically, Canadians have constituted the majority of the participants, now accounting for close to half of them, USA for around one-quarter, and with an increasing proportion of European players in recent times.
The so-called “Goals Versus Threshold” scheme, invented by Tom Awad of Hockey Prospectus in 2009, rates individual players in relation to an average of all players in the NHL and combines demonstrated offense with defence ability. Whilst it has been applied retrospectively to a number of decades, here attention is on offensive capabilities in line with soccer, rugby union, American football and basketball.
A team can draw on up to 20 players during a game, though only five skaters plus the goaltender are allowed on the ice at any given time. The “Centerman” and the two “Wingers” are predominantly engaged in offensive play. With NHL statistics, a player earns one performance point for a goal he scores and one for an assist made – being a pass that lead directly to a goal. The stats record two player assists for each goal.
Assessment was made of a field of 250 leading players, all with a minimum of 500 career points, and most of which have careers from the 1960s onwards.
Kettle – findings for ice hockey, top 12 to end 2020
| Career Span | Games | Points/Game | Z Score | ||
| 1 | Wayne Gretzky | 1979-99 | 1,487 | 1.92 | 6.18 |
| 2 | Mario Lemieux | 1984-2006 | 915 | 1.88 | 5.95 |
| 3 | Mike Bossy | 1977-87 | 752 | 1.50 | 3.59 |
| 4 | Bobby Orr | 1966-79 | 657 | 1.39 | 2.95 |
| 5 | Marcel Dionne | 1971-89 | 1,348 | 1.31 | 2.47 |
| 6 | Sidney Crosby | 2005-20 | 984 | 1.28 | 2.27 |
| 7 | Peter Stastny | 1980-95 | 977 | 1.27 | 2.18 |
| 8 | Peter Forsberg | 1994-2011 | 708 | 1.25 | 2.07 |
| 9 | Kent Nilsson | 1979-95 | 553 | 1.24 | 2.02 |
| 10 | Phil Esposito | 1963-81 | 1,282 | 1.24 | 2.01 |
| 11 | Guy Lafleur | 1971-91 | 1,126 | 1.20 | 1.78 |
| 12 | Joe Sakic | 1988-2009 | 1,378 | 1.19 | 1.71 |
Source: Hockey-Reference.com/NHL Career Leaders and Records for Points
The top two players are both Canadians. Wayne Gretzky, who began in the NHL at age 18, is the only player to have scored over 200 points in a season and has achieved this feat four times.
As to team performance, it gains two points for a win and one point for a loss either in overtime or through a subsequent shootout. If two teams are tied at the end of the regular season, based on the aggregate points gained, then a complex tie-breaking procedure comes into operation. Under these rules, the team with the greatest absolute difference between goals scored and goals conceded can be – though not necessarily – placed ahead of the other one.[ii] Eight teams from each Conference then go through to playoff for the Stanley Cup, which is a sizeable elimination tournament (four rounds of the best-of-seven games). In recent times, the top three teams in each division are guaranteed to qualify, plus two wild card spots for each conference – making a total of 16 playoff teams.
Given this context, the notion of dead runs in cricket may be considered to have a parallel with ice hockey, and also with the three other North American sports examined – that is, “dead points” scored when the opposing team has very little chance of reversing a deficit and drawing level or leading by the end of scheduled playing time. One expects a higher proportion of such points than for dead runs at cricket as, with the latter, the captain has the option of declaring the team’s innings to be closed – and once dead runs set in, he has an incentive to declare in order to reduce the opposition’s chance of salvaging a draw, whereas no such device operates in those North American sports.
Indeed, captains/managers of teams in these four sports need to have an eye during the season on points differential – the number scored for and against the team – as this might decide whether it goes through to the playoffs. Although this proves to be decisive only occasionally, the potential or prospect of it happening may be real for much of the season.
(In baseball, a team’s standing depends on the percentage of games played that are won, the outcome of each game resting on the number of runs scored by each team. For teams that are tied in top position in one of the two constituent leagues, a game is played to determine which of them goes through to the playoff series.)
(In American football, the team scoring the most points wins the match, and if points are equal after scheduled time (60 minutes of active play) an overtime period of 10 minutes operates to decide the winner, with ties resulting if the deadlock isn’t broken. Team standings are based on the proportion of games played that are won. Separating teams that are tied at season’s end is settled in a number of alternative ways, some of which relate to their respective ratios of total points won to total points conceded in the matches played.)
(In basketball, a team’s overall ratio of wins to losses determines its place in the season’s standings, with conference and division records being used as tie-breakers. One that may operate is the difference between total points scored less total points conceded against all opponents combined.)
In principle, when comparing the performance of participants in these sports it is desirable to make some allowance for “dead scoring”, specifically during those periods when a team either has very little prospect of making the playoffs or is a virtual certainty of going through. I have been able to derive some illustrative estimates for ice hockey (via Wikipedia), being the only North American sport looked at for which – prior to considering the issue of “dead points” – a leading player is found to be more dominant in their own sport than DGB is for Test cricket (when all players batting averages exclude their estimated dead runs).
A detailed analysis has been made for ice hockey’s two leaders, Gretzky (playing in 21 seasons) and Lemieux (17 seasons), and a sample of six others from the top twenty listed – collectively playing for a variety of teams:
Crosby at number 6 (16 seasons), Forsberg at 8 (13 seasons)
Nilsson at 9 (9 seasons), Sakic at 12 (21 seasons)
LaFontaine at 15 (15 seasons), Lindros at 17 (15 seasons)
One in three successive seasons were analysed for each of them. The scoring of points in every game in those sample seasons was examined to see whether the player concerned had put their team ahead by four or more points at any stage during the final session of play, or had put them five or more points ahead during the last four minutes of the second session – each of the three sessions comprising a game lasting 20 minutes. These rank as potential dead points when the season ends and the standings are finalised. The required scorecards – available from 1979 onwards – give the precise time of all goals scored, and notes the scorer plus the two final assisting players in each case.
Two lengthy days of inspecting scorecards revealed that potential dead points were material for each of the eight players, ranging from 3.6% to 7.1% of their total points scored in the seasons examined. The average for them works out at 5.3%. There is no correlation between position within the top 20 players listed above and the proportion of such points scored. Gretzky has 7.1% (as does Nilsson) and Lemieux has 3.8%, each departing materially up and down from the sample average.
The average of 5.3% has been applied to all other players in the qualifying field of 250 in order to derive a full set of adjusted dominance ratings. On this basis, Gretzky’s rating becomes 5.97 – now 3.5% higher than DGB’s rating for cricket rather than, as previously, 7.2% higher; whilst Lemieux’s rating becomes 6.14 – now 6.4% higher than DGB instead of previously only 3.2% higher. Both these changes are a direct reflection of their relation to the overall proportion of potential dead points estimated for the eight players noted. (The third player in the adjusted ranking, Bossy, is rated 3.59.)
This implies that, if an analysis were able to distinguish between genuinely dead scoring and potentially dead scoring, both Gretzky and Lemieux would still remain ahead of DGB: the former somewhere between 3.5% and 7.2% ahead and the latter between 3.2% and 6.4% ahead, both these margins being material.
Conclusions
- Impacts of updating and improved methodology
The impact of updating by itself, from early/mid 2014 – when applying Walters’ own qualifying criteria – has predominantly been to alter the dominance ratings by only a small amount:
Cricket, soccer, rugby union and golf: for the leading players listed earlier, changes to the ratings ranging from negligible to plus 0.4
Tennis (men and women): for those players listed, changes ranging from negligible to minus 0.6, except for three recently winning players at plus 1.1 to plus 2.7
Applying a more relevant qualifying threshold for Test cricket of 1,500 career runs (instead of Walters’ 2,000 runs), and for international rugby union 130 career points (instead of Walters’ 200 points), produces a further relatively small effect for the dominance ratings. For the leading players listed, there are increases of 0.12 to 0.15 for cricket – except DGB with an increase of 0.69 – and increases of 0.29 to 0.34 for rugby union.
For Test cricket, the exclusion of “dead runs” after updating has a substantial impact for DGB’s dominance rating, which falls by 0.93 or 14%; although it has very little impact on most of the other leading batsmen. The exceptions are Eddie Paynter, Jacques Kallis and Kumar Sangakkara, whose ratings fall by between 0.12 and 0.17, equating to 7%-8%.
A judicious inclusion of the more consistent one-time winners in the qualifying fields for tennis and golf raises the dominance ratings appreciably. For men’s tennis, the increases for the leading 27 players range from 0.72 at the top to 0.42 at the bottom, equating to 18% (top) and 131% (bottom). For women’s tennis, increases for the leading 21 players range from 0.52 at the top to 0.26 at the bottom, equating to 14% (top) and 197% (bottom). And for golf, for the leading 19 players there are increases of 1.51 at the top to 0.68 at the bottom, which equate to 30% (top) and 155% (bottom).
- Findings for DGB’s comparative dominance
I have applied those indicators of performance that I consider to be the most suitable of those readily available for comparing players’ abilities on a long-term (“all-time”) basis for each sport looked at.
Attention throughout has been on DGB at cricket in relation to the leaders of the other eleven sports: who exceeds DGB, or comes close to him in terms of dominance? I have not dwelt on the relativities between the leaders of those other sports. More sophisticated long-term indicators have sometimes been available and used for one sport than another that happens to be closely related – such as for hockey (goals plus assists) in contrast to soccer (goals only) – which prevents a direct comparison of their respective player dominance ratings. This is a minor drawback given the chief focus has been on comparisons with DGB.
Based on findings obtained to end of 2020, and applying the preferred participant qualifying thresholds:
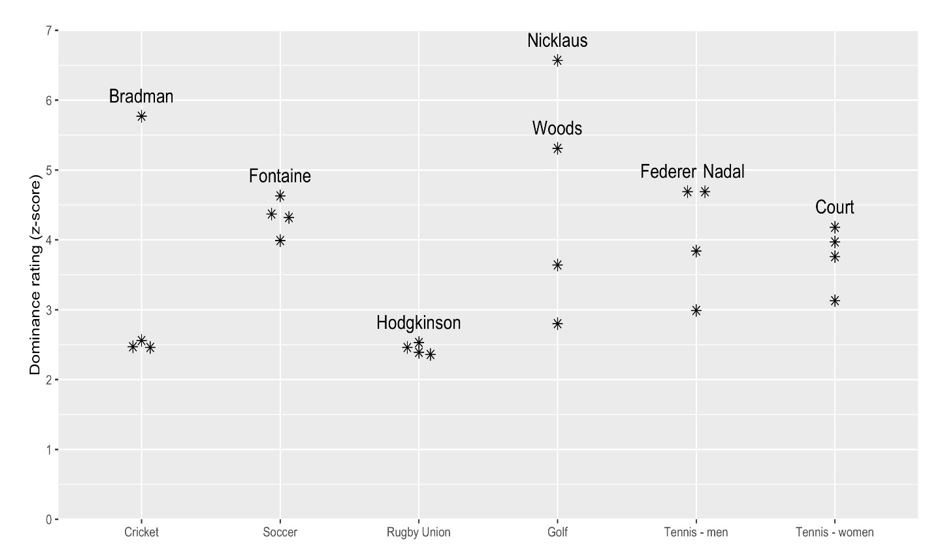
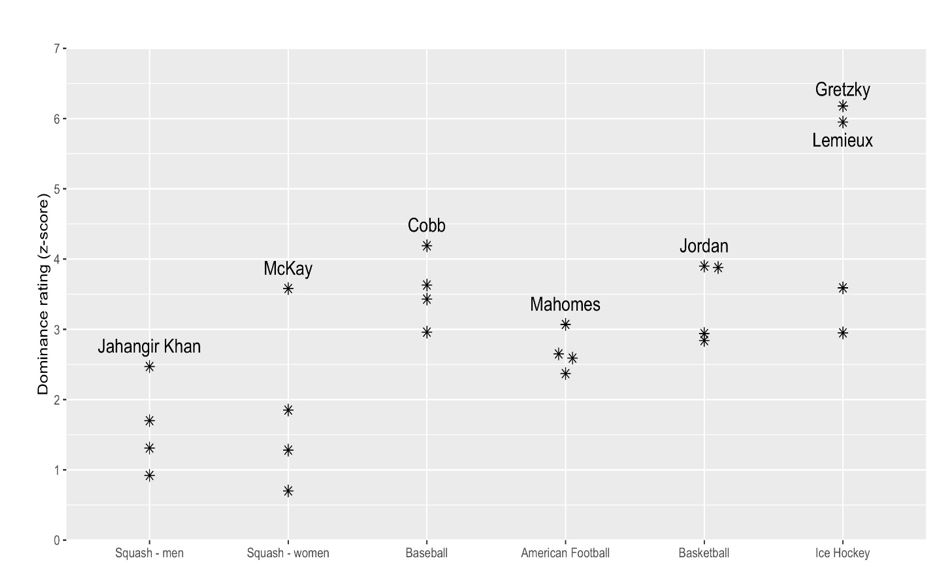
- In cricket, DGB’s lead over the next most dominant batsman – a gap of 3.21 rating points – is shown to be greater than the corresponding leader over second place for each of the other five ball sports that Walters examined, so being consistent with his own findings. DGB’s lead in cricket is also greater than the lead applying to the additional six ball sports that I have covered. The next largest leader/second place gap is 1.73, being for women’s squash, followed by 1.26 for golf. Hence, DGB is certainly pre-eminent in this regard.
- Of greater significance for this article’s main focus, though, is the finding that three players are more dominant in their own particular sports than DGB is in cricket with his rating of 5.77. These are Jack Nicklaus in golf with a rating of 6.57, and Wayne Gretzky and Mario Lemieux in ice hockey with estimated ratings of 6.18 and 5.95 respectively. At an absolute minimum, Gretzky’s rating would be 5.97, still ahead of DGB, whilst Lemieux’s rating could potentially be higher – up to 6.14. Also, golfer Tiger Woods, with a rating of 5.31, comes close to DGB.
- This overturns Walters’ finding on DGB’s status, and is a consequence primarily of the inclusion of certain one-time winners and the exclusion of “dead runs” for batting in cricket. Only if “dead runs” are retained would DGB head the leaders of all the other 11 ball sports examined. He would then have a dominance rating of 6.70, a touch ahead of Jack Nicklaus.
The best estimates of ratings obtained for the top four players of each sport examined are plotted on the following two charts.
The advances made here on Walters’ insightful assessment have enabled DGB’s standing to be viewed in a broader and enhanced context. Whilst DGB is still present among the top echelon of leaders of major ball sports, he is no longer out in front of all others. Perhaps this finding will motivate some researchers to examine those other ball sports, noted earlier, that have some claim to be in the “major” category, so that a truly definitive statement can be made about DGB’s standing.
It is also hoped that discussion, at the outset of this article, will stimulate debate on at least two matters. First, the criteria to apply for establishing those participants in a sport who are to be admitted to the field for assessing relative dominance, including the issue of the treatment of one-time only winners of tournaments. Second, whether aggregate performance over a career is to be preferred, in certain situations, to performance averaged out on a per innings, per match, or per tournament basis.
Aliam causam faciendi quod est in iconicus figura humani
End Notes
[i] Stephen Jay Gould: “Entropic Homogeneity Isn’t Why No One Hits .400 Any More.” Discover magazine, Vol 7, Number 8, August 1986, pages 60-66. Ten years later, this article was expanded in his book, Life’s Grandeur – Part Three: The Model Batter, Extinction of 0.400 Hitting and the Improvement in Baseball (pages 77-132).
[ii] Regulation plus overtime wins are used as the tie-breaker initially, and then points gained in their season head-to-head series, before aggregate goal difference can come into play.


Leave a comment