• Welcome to the Cricket Web forums, one of the biggest forums in the world dedicated to cricket.

    You are currently viewing our boards as a guest which gives you limited access to view most discussions and access our other features. By joining our free community you will have access to post topics, respond to polls, upload content and access many other special features. Registration is fast, simple and absolutely free so please, join the Cricket Web community today!

    If you have any problems with the registration process or your account login, please contact us.

How many more runs to come?

Victor Ian

International Coach
Spark Method
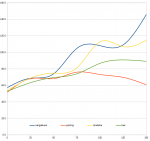
0255075100125150
sangakkara576874104108109145
ponting51686876736960
tendulkar53687481112107114
lara52636974869089

otherone.png


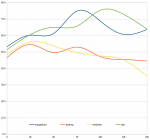
Harsh Method
0255075100125150
sangakkara53606174686063
ponting46544953474544
tendulkar48565349474535
lara51606565757264

anotherone.png

I hope you guys don't mind me attributing these methods to you. It's just the names sounds so good :)

here's the file I used if anyone wants to play themselves or find my mistakes and call me out or show me a better way to use excel for it click here.
 

harsh.ag

Cricket Web: All-Time Legend
The one with my name on it represents reality better I think.

But then again, I would :happy:
 

srbhkshk

International Captain
Doing it in 5 run increments (Harsh's method), gives this chart.

Trend.JPG

Root sucks in the 45-80 range, before and after that he does fine, Kohli is good almost everywhere although he does start to decline steadily at 70+, he'd probably improve if I extended the range but that's going into single digit data point category. One thing to notice is that Williamson isn't actually all that good at converting either, Root kind of saves him the embarrassment.
 

marc71178

Eyes not spreadsheets
As runs past a certain level are universally known as wanker runs I think we can conclude that Kohli is the biggest wanker in world cricket currently
 

weldone

Hall of Fame Member
[didn't know this thread existed, so I replied in the Maths thread]

First, you have to remove not outs for this kind of analysis (or use not outs in a different way). And after removing not outs, the sample size becomes too low for most batsmen for any meaningful analysis - specially for high scores.

Second, 'how many more they are expected to score' (expectation) is a different question compared to 'how many more runs will he score with 50% probability' (median). For all batsmen, median is much much less compared to average - around 60%. e.g., if Tendulkar averages 55 then you'll find half the times he gets out for less than 35 or so.
 
Last edited:

Top