Howe_zat
Audio File
So I was wondering, what's the bowling equivalent of averaging 40 with the bat? Or the batting equivalent of averaging 30 with the ball? How can you say if someone's a batting or bowling allrounder if they have averages in 30s?
(Disclaimer: This is a thread in which we play with numbers. If you are the sort of person who delights in telling other people that averages aren't everything, as if they don't already know that, the back button is over there.)
I thought the best way to do it was to use the average runs per wicket across all Test cricket in the 21st century - it's designed as an analysis of modern players - averages are a bit higher than they used to be as I'm sure you're aware - and find a way of showing how much better a player is than that 'standard' average.
At the time of writing, that's 32.18. So a batsman who can average twice as much as that should be twice as good as the average batsman, and a bowler who can pay half that for his wickets should be twice as good as the average bowler.
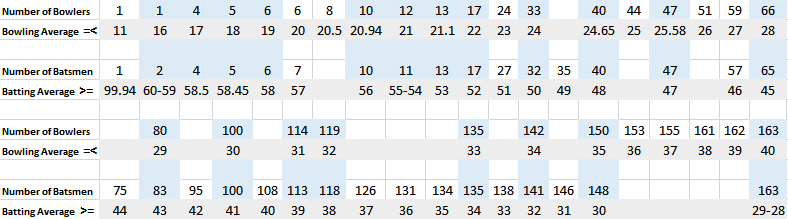
The table below gives a list of equivalent averages for batsmen and bowlers based on how many times better than that they are (given as 'index').
This is clearly a load of horlicks. There's no way that a bowler who could average 21 in the modern game isn't way out ahead of your common or garden 48 averaging batsman.
The flaw in this is that to be a batsman you need to average considerably more than the overall average runs per wicket as you need to make up for your tailenders, but the vast majority of wickets taken are by front line bowlers. So if all your bowlers take their wickets at 32 you'll have a bang average attack that bowls teams out for 320. But if all your batsmen average 32 you won't get to 320 on average because you've also got your tailenders falling short.
So I re jigged it with 38.46 as the batting benchmark - the average rpw in modern Test cricket for a top 7 player. The list goes
Which I like.
A few points
- The best averaging bowler of modern cricket (McGrath) has a roughly equivalent record to the best averaging batsman (Sangakkara), with 1.5 times the output of an average bowler and batsman respectively
- A bowling equivalent of Don Bradman would average 12.38
- Most allrounders are closer to an average bowler than an average batsman - Flintoff for example had the record of 1 average bowler but about 0.82 average batsmen. This makes sense, if an allrounder wasn't delivering a typical bowling output then you would at least reduce their bowling workload over time and make sure they were in as a batsman.
- The closest thing to a 'true' balanced allrounder that exists is probably Shakib Al Hasan, who is 1.03 times a good as a typical batsman and 0.966 times as good as a typical bowler
- If you had the same batting average as bowling average, and be completely 'balanced', you'd have a batting and bowling average of 35.18 (0.91 times as good as the typical batsman and bowler). That seems a little high at first, but this is 21st century averages we're talking about, where 35 is pretty much the minimum you can get away with as a batsman now. 35 with bat and ball is pretty much Shane Watson's record, curiously.
(Disclaimer: This is a thread in which we play with numbers. If you are the sort of person who delights in telling other people that averages aren't everything, as if they don't already know that, the back button is over there.)
I thought the best way to do it was to use the average runs per wicket across all Test cricket in the 21st century - it's designed as an analysis of modern players - averages are a bit higher than they used to be as I'm sure you're aware - and find a way of showing how much better a player is than that 'standard' average.
At the time of writing, that's 32.18. So a batsman who can average twice as much as that should be twice as good as the average batsman, and a bowler who can pay half that for his wickets should be twice as good as the average bowler.
The table below gives a list of equivalent averages for batsmen and bowlers based on how many times better than that they are (given as 'index').
Code:
Batting	Bowling	Index
64.36	16.09		2
61.142	16.93684211	1.9
57.924	17.87777778	1.8
54.706	18.92941176	1.7
51.488	20.1125		1.6
48.27	21.45333333	1.5
45.052	22.98571429	1.4
41.834	24.75384615	1.3
38.616	26.81666667	1.2
35.398	29.25454545	1.1
32.18	32.18		1
28.962	32.50505051	0.9
25.744	36.56818182	0.8
22.526	41.79220779	0.7
19.308	48.75757576	0.6
16.09 58.50909091 0.5The flaw in this is that to be a batsman you need to average considerably more than the overall average runs per wicket as you need to make up for your tailenders, but the vast majority of wickets taken are by front line bowlers. So if all your bowlers take their wickets at 32 you'll have a bang average attack that bowls teams out for 320. But if all your batsmen average 32 you won't get to 320 on average because you've also got your tailenders falling short.
So I re jigged it with 38.46 as the batting benchmark - the average rpw in modern Test cricket for a top 7 player. The list goes
Code:
Batting	Bowling		Index
76.92	16.09		2
73.074	16.93684211	1.9
69.228	17.87777778	1.8
65.382	18.92941176	1.7
61.536	20.1125		1.6
57.69	21.45333333	1.5
53.844	22.98571429	1.4
49.998	24.75384615	1.3
46.152	26.81666667	1.2
42.306	29.25454545	1.1
38.46	32.18		1
34.614	32.50505051	0.9
30.768	36.56818182	0.8
26.922	41.79220779	0.7
23.076	48.75757576	0.6
19.23 58.50909091 0.5A few points
- The best averaging bowler of modern cricket (McGrath) has a roughly equivalent record to the best averaging batsman (Sangakkara), with 1.5 times the output of an average bowler and batsman respectively
- A bowling equivalent of Don Bradman would average 12.38
- Most allrounders are closer to an average bowler than an average batsman - Flintoff for example had the record of 1 average bowler but about 0.82 average batsmen. This makes sense, if an allrounder wasn't delivering a typical bowling output then you would at least reduce their bowling workload over time and make sure they were in as a batsman.
- The closest thing to a 'true' balanced allrounder that exists is probably Shakib Al Hasan, who is 1.03 times a good as a typical batsman and 0.966 times as good as a typical bowler
- If you had the same batting average as bowling average, and be completely 'balanced', you'd have a batting and bowling average of 35.18 (0.91 times as good as the typical batsman and bowler). That seems a little high at first, but this is 21st century averages we're talking about, where 35 is pretty much the minimum you can get away with as a batsman now. 35 with bat and ball is pretty much Shane Watson's record, curiously.