• Welcome to the Cricket Web forums, one of the biggest forums in the world dedicated to cricket.

    You are currently viewing our boards as a guest which gives you limited access to view most discussions and access our other features. By joining our free community you will have access to post topics, respond to polls, upload content and access many other special features. Registration is fast, simple and absolutely free so please, join the Cricket Web community today!

    If you have any problems with the registration process or your account login, please contact us.

Best performed cricketers across all conditions and vs any opponent

The Sean

Cricketer Of The Year
Yeah, I'm done.


Qualifications: 3250+ career runs. 100+ wickets.
Loving this. My only possible amendment might be around the distribution of equivalencies - as it stands (assuming I'm reading it correctly), batting averages of 58-60 match with bowling averages all the way from 16-19, yet all the batting averages from 53-56 are equivalent to a bowling average of 21. Do you think there might be a way of evening out the spread there?
 

G.I.Joe

International Coach
Loving this. My only possible amendment might be around the distribution of equivalencies - as it stands (assuming I'm reading it correctly), batting averages of 58-60 match with bowling averages all the way from 16-19, yet all the batting averages from 53-56 are equivalent to a bowling average of 21. Do you think there might be a way of evening out the spread there?
Partly my fault. I bunched up the columns to fit the entire thing on one screen, which caused a few decimal places to disappear. Mostly, it's a limitation of the data. The relationship between the two sets isn't linear all along the way. I can't imagine the curves if this was plotted on a graph!


Better formatting:


The Sean

Cricketer Of The Year
Partly my fault. I bunched up the columns to fit the entire thing on one screen, which caused a few decimal places to disappear. Mostly, it's a limitation of the data. The relationship between the two sets isn't linear all along the way. I can't imagine the curves if this was plotted on a graph!

Better formatting:


Ha ha, yeah I knew what you'd done and what was causing it. I was talking more just about the fact it was somewhat counter-intuitive that, for example, Marshall (bowling average 20.94) has an equivalent batting average of 56 while McGrath (21.64) has an equivalent of just 52. Or even more perversely, Neil Adcock (21.10) only 53!

As you say though, it's predominantly a case of the data sets not being linear rather than a fundamental problem with the methodology.

I'm not sure what I started here!
Something beautiful.
 

ankitj

Hall of Fame Member
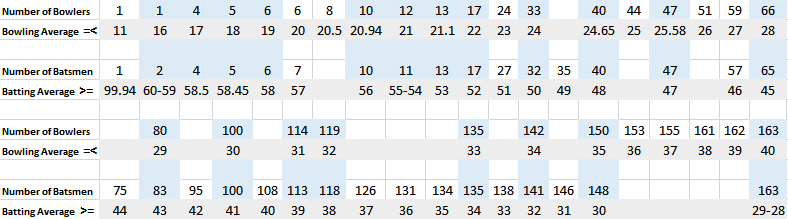
Players with their batting and bowling flipped, using the equivalent averages (i.e, batting all-rounders converted to bowling all-rounders and vice versa):

I know it is not an accurate representation because it does not take plenty of relevant factors into account. I don't care. It's fun.

Garry Sobers - bowl ave 19, bat ave 32
Jacques Kallis - bowl ave 21, bat ave 36
Aubrey Faulkner - bowl ave 30, bat ave 46

Richard Hadlee - bat ave 51, bowl ave 41
Imran Khan - bat ave 51, bowl ave 32
Keith Miller - bat ave 51, bowl ave 32
Ian Botham - bat ave 44, bowl ave 33
Kapil Dev - bat ave 42, bowl ave 34
Wilfred Rhodes - bat ave 46, bowl ave 35
Vinoo Mankad - bat ave 37, bowl ave 34
Chris Cairns - bat ave 42, bowl ave 33
Andrew Flintoff - bat ave 35, bowl ave 34

Malcolm Marshall - bat ave 56, bowl ave probably 50+
Wasim Akram - bat ave 50, bowl ave probably 50+
Well, that puts Kallis, Miller and Imran roughly even.
Yup. They bring maximum value as all rounders.
 

Top