• Welcome to the Cricket Web forums, one of the biggest forums in the world dedicated to cricket.

    You are currently viewing our boards as a guest which gives you limited access to view most discussions and access our other features. By joining our free community you will have access to post topics, respond to polls, upload content and access many other special features. Registration is fast, simple and absolutely free so please, join the Cricket Web community today!

    If you have any problems with the registration process or your account login, please contact us.

The flaw in batting averages

Lillian Thomson

Hall of Fame Member
It's funny how I've seen you admonish people for speaking out of their bounds of expertise. You should considering following your own advice.

One more time, with feeling; number of runs is the data, average describes the data.
You can say whatever you want as many times as you want with as much feeling as you want, it doesn't alter the fact that the batting average is the number of runs scored divided by the number of times dismissed and it's a plain simple fact showing what happened, there's no expertise required.
 

Top_Cat

Request Your Custom Title Now!
You can say whatever you want as many times as you want with as much feeling as you want, it doesn't alter the fact that the batting average is the number of runs scored divided by the number of times dismissed and it's a plain simple fact showing what happened, there's no expertise required.
Okay so your definition of a fact is colloquial whereas mine is mathematical. Fine. I won't subject the forum to my argument.
 

Debris

International 12th Man
If you want them to be a closer appoximation to relative ability then they can be played with in a number of different ways. Firstly take runouts out. They are a dismissal but dont relate to batting ability.
QUOTE]

I really disagree strongly here. Being able to run well is an essential skill to a batsman. You only have to look at Dean Jones and Inzamam-ul-Haq to see the difference. Or any tail-ender. And, of course, a batsman who takes risks running is more likely to suffer run-outs but keeps his score ticking so it is a bit of a risk-reward thing.
 

FaaipDeOiad

Hall of Fame Member
I don't necessarily believe that removing the advantage in batting average from batsmen who are regularly not out improves the relative accuracy of averages in determining player ability.

The one problem with not outs is that they don't differentiate between when a batsman is simply too good to be dismissed and when a batsman could perhaps have made more runs if he'd taken more risks, but preserved his wicket at the expense of the team. There's a difference between the two. With all due respect to Bevan, who is one of my favourite ever ODI cricketers, he fell on both sides of this line at different times. Really though, statistics never manage to represent intangible factors like this, so batting average is hardly alone.

If you roundly penalise batsmen who are often not out you diminish the value of a lot of quite significant achievements IMO. It doesn't "improve" the value of batting average as a statistical measure. Nothing wrong with using "runs per innings" as a different statistic for the purpose of comparison, though.
 

pasag

RTDAS
The one problem with not outs is that they don't differentiate between when a batsman is simply too good to be dismissed and when a batsman could perhaps have made more runs if he'd taken more risks, but preserved his wicket at the expense of the team. There's a difference between the two. With all due respect to Bevan, who is one of my favourite ever ODI cricketers, he fell on both sides of this line at different times.
Actually come to think of it, Charles Davis in his Best of the Best book is said to have said (haven't read it myself, hard to find a copy as it's out of print) that if anything not outs hurt the batsman:

Another myth that Davis examines is the issue of remaining not out and its affect on your batting average. Davis turns our thinking around, and points out that a not-out innings is actually a missed opportunity to score more runs. By missing out on runs whilst set, the batsman is actually reducing his overall career average. Davis explores this situation, and puts forward a convincing argument that if batsmen were able to play all their unbeaten innings to a conclusion, they would actually end up with a higher career batting average.


http://historyofcricket.*************/2007/12/book-review-best-of-best-by-charles.html (The blog of one of our cricket book reviews, incidentally)
 

slugger

State Vice-Captain
the timeless tests in theory would eliminate the not out skews on ya avg. but hey those days are long gone.
 

pasag

RTDAS
David Barry of the blog 'Pappus' plane - cricket stats' rejects this analysis btw. He offers an alternative solution for dealing with not outs in ODIs:

In my post on adjusting averages for not-outs in Tests, commenter Rich asked about doing the same in ODI's. At first I thought that this would be too difficult, but I decided that with an hour of mindless copy-pasting from Statsguru, I could at least get it working for individual players.

(Usually I'd rather watch paint dry than copy-paste Statsguru data for an hour, but it's not so bad you're listening to the Champions League football on the radio.)

There's one very important difference for this exercise between ODI's and Tests. In Tests, pretty much all the top batsmen can expect to bat out their innings most of the time. In ODI's, the top order can usually do this, but the middle order often have to slog at the end. So whereas an opener can get a start of 50 and carry on to a century, the number six who gets to 50 will often get out soon afterwards.

So I split the analysis into two parts: one for the top order (1-3), and one for the middle order (4-7). Perhaps 1-4 and 5-7 would have been better, but I can hardly be bothered re-gathering the data.

I only considered batsmen with an average of 35 or more, and only considered innings in the last ten years, since there's been a big explosion in ODI run habits recently.

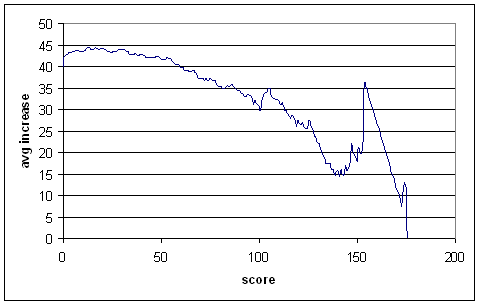
First up, projected increases for the top order:


This is similar to the Test graph — batsmen clearly get their eye in after scoring some runs — but the downward trend starts much earlier, as is expected. After about 60 runs, the average increases are less than the overall average for this dataset (almost exactly 40). So not-outs tend to deflate averages when the score is below 60, but inflates them afterwards.

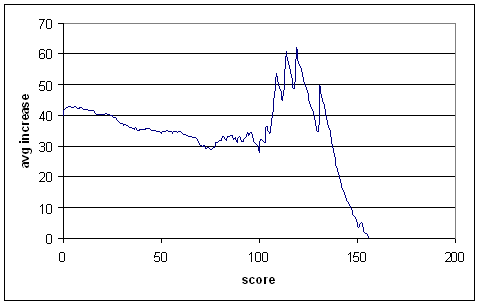
And now for the middle order:


I wouldn't pay much attention to the curve out past 100, since there's not much data there. It won't make too much difference, since there aren't that many unbeaten centuries in the middle order.

The curve is quite different from that of the top order, in roughly the way we would expect. Not-outs have a deflating effect on averages only up to 25 runs or so, and after that they inflate averages.

Now, I haven't done a thorough analysis on all batsmen, since I don't have that data handy. I've just done some selected cases. Some caveats: Some of the batsmen played earlier than ten years ago, and perhaps the average increase curves was different then. Also, I've applied either top order or middle order adjustments to each batsman, and not both. This won't have too much of an effect, but to do it properly you'd want to split the innings into top-order and middle-order and do them separately. If a batsman's highest score was a not-out, I added the average increase to it. (For Tests, I added the batsman's regular average, but doing so in ODI's is much less accurate.)

In the table below there are four averages presented: the regular average, one adjusted based purely on the batsman's own scores, one based purely on the relevant graph above (shifted up or down to match the batsman's regular average), and one mixture of the two, giving more weight to the graph when the batsman doesn't have many scores greater than or equal to the not-out being projected. I've called these reg, ind, gph, mix. The latter one is the one I'd go with. There's two openers, and the rest from the middle order.

player inns no reg ind gph mix
SR Tendulkar 407 38 44,3 43,4 43,9 43,5
SC Ganguly 300 23 41,0 40,6 40,6 40,6
---
MG Bevan 196 67 53,6 48,1 52,4 48,8
L Klusener 137 50 41,1 41,7 40,1 41,4
MEK Hussey 64 26 55,6 55,0 54,4 54,9
A Symonds 154 32 39,7 40,1 39,0 39,9
DR Martyn 182 51 40,8 42,1 40,0 41,6
RP Arnold 155 43 35,3 33,5 34,6 33,8

Bevan's average has, contrary to my expectations, been pulled back quite a bit, down below 49. Nevertheless, it's still a lot higher than most Bevan sceptics would have it. I wouldn't want to draw too many general conclusions from what was a deliberately biased set of batsmen (all with fairly high not-out proportions), but it looks like ODI averages can be and sometimes are inflated by not-outs much more than Test averages.
 

weldone

Hall of Fame Member
The measure is very much flawed because without even considering strike rates, it tries to come up with a ranking of ODI batsmen which is believable; and I am amazed that the creator takes pride on it.
 

weldone

Hall of Fame Member
If you're trying to use the batting average as the primary measure of a batsman's performance, then it clearly is a problem.
But the problem with that thinking is that a batsman's performance in ODI cricket can't be measured by batting average or any similar measure alone....because in ODI cricket how many runs you score is of equal importance to how quickly you score it (generally)...Well, the story is different in test cricket...
 

Lillian Thomson

Hall of Fame Member
If you're trying to use the batting average as the primary measure of a batsman's performance, then it clearly is a problem.
Stats in cricket are a pure record of actual events. If a batsman scores X number of runs and is dismissed Y number of times, that's what happened. There's no flaw in it, the flaws only arise because first year graduates see all these lovely numbers floating around and think they can prove who was greater by artificially manipulating them. The more fancy equations you attempt to add the further away from the truth you get.
 

nightprowler10

Global Moderator
Stats in cricket are a pure record of actual events. If a batsman scores X number of runs and is dismissed Y number of times, that's what happened. There's no flaw in it, the flaws only arise because first year graduates see all these lovely numbers floating around and think they can prove who was greater by artificially manipulating them. The more fancy equations you attempt to add the further away from the truth you get.
I don't see what's so wrong about trying to perfect how the average is calculated when the current system is obviously not flawless, unless of course you fully agree that Bevan was a better ODI batsman than Viv, Punter, and Sachin.
 

Lillian Thomson

Hall of Fame Member
I don't see what's so wrong about trying to perfect how the average is calculated when the current system is obviously not flawless, unless of course you fully agree that Bevan was a better ODI batsman than Viv, Punter, and Sachin.

Stats are a historical record, I don't need them to tell me who the better batsman is from those examples. When you start adding variables it's all open to conjecture. There is no calculation that can factor in different circumstances, different era's, strength of bowling and every unique match situation. I don't care what individuals do for their own amusement as long as they don't incorporate things that didn't happen into the official records.
 

Migara

Cricketer Of The Year
If we assume that batsman has a 50-50 chance of improving his average if he's not out. Then according to the SR we can calculate a Risk Index. since I assumed on 50-50 rule, I calculated two Risk indexes. One was (Runs * Strike rate) / (Innings * 100 ). The second parameter I used was average * Strike rate / 100. Then I took average of both.

Top ten came as

KP Pietersen (Eng/ICC) - 39.7
IVA Richards (WI) - 39.3
MEK Hussey (Aus) - 38.5
Zaheer Abbas (Pak) - 38.4
MS Dhoni (Asia/India) -36.5
SR Tendulkar (India) - 36.1
AC Gilchrist (Aus/ICC) - 34.1
A Symonds (Aus) - 33.0
MG Bevan (Aus) - 32.9
ML Hayden (Aus/ICC) - 32.9

Few unexpected ones as MS Dhoni and MEK Hussey! But any one will agree that it has cream of the ODI batsmen. For a better comparison, Average of the bastmen has to be standardized against opposition and playing venue (home / away / neutral). Then another standardization has to be done to address the general increase of SR among batsmen. It would give a very good measurement of the Risk index.
 

weldone

Hall of Fame Member
If we assume that batsman has a 50-50 chance of improving his average if he's not out. Then according to the SR we can calculate a Risk Index. since I assumed on 50-50 rule, I calculated two Risk indexes. One was (Runs * Strike rate) / (Innings * 100 ). The second parameter I used was average * Strike rate / 100. Then I took average of both.

Top ten came as

KP Pietersen (Eng/ICC) - 39.7
IVA Richards (WI) - 39.3
MEK Hussey (Aus) - 38.5
Zaheer Abbas (Pak) - 38.4
MS Dhoni (Asia/India) -36.5
SR Tendulkar (India) - 36.1
AC Gilchrist (Aus/ICC) - 34.1
A Symonds (Aus) - 33.0
MG Bevan (Aus) - 32.9
ML Hayden (Aus/ICC) - 32.9

Few unexpected ones as MS Dhoni and MEK Hussey! But any one will agree that it has cream of the ODI batsmen. For a better comparison, Average of the bastmen has to be standardized against opposition and playing venue (home / away / neutral). Then another standardization has to be done to address the general increase of SR among batsmen. It would give a very good measurement of the Risk index.
And due weightage should be given on longetivity...A career spanning 15 years mustn't be equated with a career spanning 4-5 years...I believe the following shouldn't be a bad idea to start with -

Points = {(average * strike rate) of the batsman / (average * strike rate) for all batsmen in same period against same oppositions} + {number of years played * constant}
 
Last edited:

Migara

Cricketer Of The Year
This time calculated the average SR and Avg of all the batsmen during each players career. The cut off point is 2000 runs. The top 20 appeared as

Code:
[B]Pos	Batsman			Risk Index[/B]
1	IVA Richards (WI)	48.3
2	Zaheer Abbas (Pak)	48.2
3	KP Pietersen (Eng/ICC)	42.4
4.	MEK Hussey (Aus)	41.2
5	SR Tendulkar (India)	40.3
6	MS Dhoni (Asia/India)	39.1
7	AC Gilchrist (Aus/ICC)	37.3
8	MG Bevan (Aus)		36.7
9	ML Hayden (Aus/ICC)	36.3
10	RT Ponting (Aus/ICC)	36.0
11	A Symonds (Aus)		35.9
12	DM Jones (Aus)		35.3
13	GS Chappell (Aus)	35.1
14	GC Smith (Afr/SA)	34.9
15	Saeed Anwar (Pak)	34.4
16	CG Greenidge (WI)	34.0
17	MJ Clarke (Aus)		34.0
18	BC Lara (ICC/WI)	33.9
19	ME Trescothick (Eng)	33.8
20	L Klusener (SA)	33.4
 

nightprowler10

Global Moderator
Stats are a historical record, I don't need them to tell me who the better batsman is from those examples. When you start adding variables it's all open to conjecture. There is no calculation that can factor in different circumstances, different era's, strength of bowling and every unique match situation. I don't care what individuals do for their own amusement as long as they don't incorporate things that didn't happen into the official records.
What exactly did he the article in question do that didn't happen?
 

Migara

Cricketer Of The Year
And due weightage should be given on longetivity...A career spanning 15 years mustn't be equated with a career spanning 4-5 years...I believe the following shouldn't be a bad idea to start with -

Points = {(average * strike rate) of the batsman / (average * strike rate) for all batsmen in same period against same oppositions} + {number of years played * constant}
I tried a polynominal regression analysis of avg vs number of years played. As expected I got a hyperbolic curve. I restricted my analysis to top order (1-7 according to statsguru).


Since at 0 innigs score should be 0. Intercept was set to zero.
 
Last edited:

Migara

Cricketer Of The Year
Then I took number of Innigs played. Players in early days played less matches per year. So with regards to them the time they played is important. For newer ones the number of innigs is imprtant.

The results are like this


Here also intercept was set to zero. As 0 innigs means 0 runs.
 
Last edited:

Top