• Welcome to the Cricket Web forums, one of the biggest forums in the world dedicated to cricket.

    You are currently viewing our boards as a guest which gives you limited access to view most discussions and access our other features. By joining our free community you will have access to post topics, respond to polls, upload content and access many other special features. Registration is fast, simple and absolutely free so please, join the Cricket Web community today!

    If you have any problems with the registration process or your account login, please contact us.

Evaluating the top all rounders of all time

marc71178

Eyes not spreadsheets
LongHopCassidy said:
Have you a better system?

I personally think some all time legends are reigning in this era.
I don't think there's more than about 2 batsmen I'd class as that in current cricket
 

Mr. P

International Vice-Captain
Scaly piscine I understand you've put a lot of time and effort into your methods...but mate wickets aren't everything...economy HAS to be taken into account. Kallis is a must inside top 5 AR for me...batting average of 53 and bowling of 30 is insanely good...
 

marc71178

Eyes not spreadsheets
So which of Sobers, Imran, Botham, Hadlee or Dev would he displace and he's actually have to displace more than that when you add in the likes of Miller.

I doubt his bowling average will below 30 by the end of his career.
 

SJS

Hall of Fame Member
Mr. P said:
Scaly piscine I understand you've put a lot of time and effort into your methods...but mate wickets aren't everything...economy HAS to be taken into account. Kallis is a must inside top 5 AR for me...batting average of 53 and bowling of 30 is insanely good...
Well. Let me tell you why I took wkts per test.

The big problem with average (runs per wicket) is that it can be used only to compare bowlers of the same era. The batting averages (and therefore also the bowling averages) have varied very considerably overtime. Particularly till about 1930. After that it seems to have become more stable. I have posted era wise averages in another thread which clearly shows that. The difference is HUGE. For example, South Africa, for twenty years averaged below 10 per wicket in their batting averages. Clearly any bowler who averaged 15 to 20 runs per wicket against South Africa in that period must be classified as below average by prevailing standards !! You know what we would think of an average of sub-20 today !!

So, in order to compare bowlers from very different eras, I decided to use wickets/test. Now I did realise that there would be a scope for 'error' by delinking runs from a bowlers performance. So I did a comparison for the top bowlers by plotting their bowling averages against their runs per wicket. You will be amazed at the degree of corelation. A graph of the inverse of average (it is required to take an inverse to visually see the corelation on a graph) against wkts per test ran almost entirely parallel. Its only when you come to the less accomplished bowlers, (really bad averages), that the relationship became less close.

As I have suggested elsewhere on this thread, its possible to have a run based criteria which accounts for the era-based differences, but thats very time consuming and I need to devise a faster way of getting at those stats.

As far as the time this excercise has taken, well it doesnt take as long as you imagine, since I have my own data base (compiled from data sources on the net ) which gives me data in many different ways from which I can quickly take the kind of information I need. :p

I dont spend as much time calculating figures as you may get to think looking at the analysis here.
 

marc71178

Eyes not spreadsheets
SJS said:
So I did a comparison for the top bowlers by plotting their bowling averages against their runs per wicket. You will be amazed at the degree of corelation.
I'd expect a perfect correlation ;)
 

Deja moo

International Captain
SJS said:
Well. Let me tell you why I took wkts per test.

The big problem with average (runs per wicket) is that it can be used only to compare bowlers of the same era. The batting averages (and therefore also the bowling averages) have varied very considerably overtime. Particularly till about 1930. After that it seems to have become more stable. I have posted era wise averages in another thread which clearly shows that. The difference is HUGE. For example, South Africa, for twenty years averaged below 10 per wicket in their batting averages. Clearly any bowler who averaged 15 to 20 runs per wicket against South Africa in that period must be classified as below average by prevailing standards !! You know what we would think of an average of sub-20 today !!

So, in order to compare bowlers from very different eras, I decided to use wickets/test. .
How does using wickets per test make it any better ? That assumes that the type of wickets used havent changed at all throughout history.
 

SJS

Hall of Fame Member
Deja moo said:
How does using wickets per test make it any better ? That assumes that the type of wickets used havent changed at all throughout history.
It is better because there are only ten wickets per innings or twenty in a match maximum to be taken. Laker's 19 wickets in a test would be equally impressive in any period because the other bowlers in his side would also be trying to get the same batsmen out under identical conditions.

It shows how good a bowler was in relation to his conditions by comparing him with others on a criteria which doesnt change over time. There is no way a bowler can take more than 20 wickets in a test or 10 wickets in an innings irrespective of conditions.

The only way to compare people of different ages is to weigh them against their peers of course.
 

SJS

Hall of Fame Member
Deja moo said:
How does using wickets per test make it any better ? That assumes that the type of wickets used havent changed at all throughout history.
For example, the best bowlers of the 19th century (Lohmann etc) got their wkts at 10-15 runs per wicket while the best of today (Warne and Murali) get them at 20-25. This would make Lohmann and his peers twice as good as the best bowlers of today. However, if you take the wickets per test criteria, the best bowlers of both periods get about 5 to 6 wickets per test. I hope this answers your question better.
 

Steulen

International Regular
OK, folks, I promised this some pages ago, and here it is: my statistical approach at finding the best allrounders.

I've pushed some figures around, and the approach that satisfied me most was this:

I first took the original list of allrounders compiled by SJS and then added Kallis as a 'nearly man' (mainly to see how someone from outside the set boundaries would fit into this elite group). This gave me a list of 18 allrounders. To make bowling and batting stats comparable, I calculated standardized normal scores a.k.a. z-scores, using the mean and standard deviation from this group of players.
The next step was to make scatterplots, plotting a bowling variable against a batting variable.

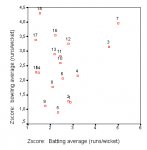
In bowlavbatav0.jpg, standardized batting average is plotted against standardized bowling average.
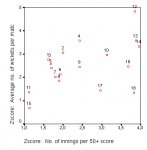
In wickmtchinn500.jpg, standardized innings per 50 score is plotted against standardized wickets per match score.

Then, the key is to combine the batting and bowling characteristic into one score with which you can compare the different players.

For batting and bowling average, the best player is of course he who combines the lowest batting average with the highest bowling average. In the first scatterplot, that's the player whose datapoint is closest to the lower right corner of the plot. in the second scatterplot, it's the player who is closest to the upper left corner of the plot.

Those of you with some knwoledge of ancient Greece may notice that you can compute the distance from a datapoint to the corner of the plot using that old bugger a^2 + b^2 = c^2, and that's what I did.

The exact formulas to calculate the distances top the best corners for both plots were:

plot 1: distance = sqrt(((6-zbatav)^2)+zbowlav^2)
plot 2: distance = sqrt(((5-zwickmatch)^2)+zinnp50^2)

Note that the subtraction is needed to get the direction of the vector right, and that the figure that is used to subtract from is arbitrary. Which number is used does affect the outcome, but the 6 and 5 used here mean that both the bowling and batting vector are on average (roughly) equal. Varying the arbitrary subtraction number only influences the outcome of the analyses if you take stupid arbitrary numbers :D

Without further ado, what are the results?

Using the bowling and batting average as the basis for analysis, this is the top 5:

1. Imran Khan
2. Miller
3. Kallis
4. Faulkner
5. Pollock

Using the wickets per match and innings per 50, you get:

1. Gregory
2. Botham
3. Cairns
4. Imran Khan
5. Faulkner

The first analysis appears to slightly favour players with an extreme average in either bowling or batting (e.g., Kallis and Pollock), whereas the second analysis yields a top 5 who are more clustered in the centre of the graph, indicating that they are good at both rather than great at one.

For those of you looking for a clear-cut answer, I've added up the ranks for all players from the two analyses, and it results in this list:

1. Imran Khan
2.Miller
3. Faulkner
4. Botham
5. Gregory
6. Goddard
7. Cairns
8. Noble
9. Sobers
10. Pollock
11. Kallis
12. Kapil Dev
13. Hadlee
14. Mankad
15. Benaud
16. Giffin
17. Durrani & Sinclair

Make of it what you will, but this is the most statistically sound comparison I could come up with based on SJS' original table.

EDIT: the numbers in the plots refer to that player's position in the rankings for that analysis, so numbers do not represent the same players across plots
 

Attachments

Last edited:

Magrat Garlick

Global Moderator
Steulen said:
For batting and bowling average, the best player is of course he who combines the lowest batting average with the highest bowling average.
Confirming what I've always thought...let's hear it for England's best ODI all-rounder ever, Rikki Clarke! :happy:

Forgot to mention, great work :) :p
 

Jamee999

Hall of Fame Member
A slight flaw in SJS' Bowler system

29 MacGill, Stuart 10.99
30 Pollock, Shaun 10.95

MacGill!!!!????!!!!????
 

Steulen

International Regular
Samuel_Vimes said:
Confirming what I've always thought...let's hear it for England's best ODI all-rounder ever, Rikki Clarke! :happy:

Forgot to mention, great work :) :p
:oops:

I won't be a spoilsport and edit it away, though

and thanks :)
 

wickies 4 ar's

Cricket Spectator
well like my post I think the best way of deciding the top all rounders of all time (probably not in order) should be decided by whether their batting average is better than their bowling average. an example would be bradman may have an average of 99.94 but his bowling average (even though he only bowled once) would be probably be around 200. think on the other side of the equation and the bowlers with low averages which would leave murali with a bowling average of 22-23 but a batting average of less than 10. mcGrath with an average of again around 22 but a batting average of 7.53. this obviously doesn't decide who is the best ever but it certainly decides with ones are better than other ones.
 

Mr Mxyzptlk

Request Your Custom Title Now!
Jamee999 said:
A slight flaw in SJS' Bowler system

29 MacGill, Stuart 10.99
30 Pollock, Shaun 10.95

MacGill!!!!????!!!!????
Wouldn't it rather be batting minus bowling rather than bowling minus batting? It's still flawed, but in this instance MacGill would be a minus number and Pollock positive, meaning Pollock is the superior.
 

Deja moo

International Captain
SJS said:
It is better because there are only ten wickets per innings or twenty in a match maximum to be taken. Laker's 19 wickets in a test would be equally impressive in any period because the other bowlers in his side would also be trying to get the same batsmen out under identical conditions.

It shows how good a bowler was in relation to his conditions by comparing him with others on a criteria which doesnt change over time. There is no way a bowler can take more than 20 wickets in a test or 10 wickets in an innings irrespective of conditions.

The only way to compare people of different ages is to weigh them against their peers of course.
That is assuming that all teams had balanced bowling attack. Marshall would have lower wickets per test than Murali, just because he was part of a better attack than Murali. That doesnt mean he is inferior to Murali. Put Murali in the Windies' attack of the eighties, and place Marshall in the Sri Lankan one. The wickets per test would be altered dramatically.
 

Top