Cricket’s Eric Clapton
Dave Wilson |
Like many England fans I very much enjoyed seeing both Alastair Cook and Kevin Pietersen equal the English record for most Test centuries during that great win at Mumbai in November 2012, to rank alongside the likes of Walter Hammond, Colin Cowdrey and Geoff Boycott. Hot on the heels of that momentous occasion, The Daily Mail asked how they figured in the all-time list of England batsmen. Though the majority went for Gooch, basing their assessment on players they’d actually seen, Bumble went for the man he described as “Cricket’s Eric Clapton”, Kevin Pietersen. Comparing Cook’s batting to an evening at the theatre, he admitted to preferring the rock and roll of Pietersen’s repertoire.
As an erstwhile guitarist myself, I feel Clapton has been either over-rated, as he was early in his career, or under-rated, as he seems to be now. While I don’t personally think he’s the best of all-time, what I did appreciate about Clapton is that he has the ability to drop back into the ensemble when necessary, happy to give up the spotlight to his fellow musicians, an ability which not all frontmen can lay claim to.
Pietersen meanwhile, the man who has three lions tatooed on his shoulder, has been criticised for not being a team player, and in particular for getting out to unnecessarily flamboyant shots when the team needed him to stay in. One of the benefits of my impact measurement method is that it takes into account when a player gets out at inopportune times, insofar as the increase in the fielding team’s win probability will be that much more, hence penalising hte dismissed batsman. For example, if a batsman gets out for a duck in the third innings, fifth man down but with his team ahead by 300, that’s worth about a 3% increase in the fielding side’s win probaility; however if the same batsman is fifth out for a duck 165 runs short of a fourth innings target, that’s worth about 15% to the fielding side.
A failure therefore can be measured, not by how many runs are scored or not scored, as the case may be, but whether or not the dismissal at the time the batsman was out had a negative impact on the batting side’s win probability. If KP has truly, and regularly, got himself out at inopportune times this will be reflected in his impact percentage.
Going back to the all-time England greats, and seeing as how the ECB has performed that uniquely British feat of voluntarily making its side easier to beat by ending Pietersen’s England career, does Pietersen belong in that conversation? Certainly my colleague Martyn thinks so, agreeing with Bumble that he’s the best of his time. I took the time to analyse KP’s career impact in Tests and compared it to several England greats, namely:-
Jack Hobbs
Herbert Sutcliffe
Walter Hammond
Len Hutton
Dennis Compton
Peter May
Colin Cowdrey
Ted Dexter
Ken Barrington
Geoff Boycott
Graham Gooch
David Gower
Michael Atherton
Alec Stewart
Michael Vaughan
Andrew Strauss
Kevin Pietersen
Alastair Cook
Admittedly an eclectic assortment but I’ve included most of the highest run scorers with a few favourites, such as Dexter, thrown in for good measure. I included Dexter as in my memory he was a swashbuckler like Pietersen. Let’s first compare their standard stats – I’ve restricted the comparison to performances in Test cricket, as prior to Boycott’s time no ODIs were played. Here are the main numbers, ranked on total runs scored in Tests:-
| Player | Tests | Inns | Runs | Ave | 100s | 50s |
| Gooch | 118 | 215 | 8900 | 42.58 | 20 | 46 |
| Stewart | 138 | 235 | 8463 | 39.54 | 15 | 45 |
| Gower | 117 | 204 | 8231 | 44.25 | 18 | 39 |
| Pietersen | 104 | 181 | 8181 | 47.28 | 23 | 35 |
| Boycott | 108 | 193 | 8114 | 47.72 | 22 | 42 |
| Cook | 102 | 183 | 8047 | 46.51 | 25 | 35 |
| Atherton | 115 | 212 | 7728 | 37.69 | 16 | 46 |
| Cowdrey | 114 | 118 | 7624 | 44.06 | 22 | 38 |
| Hammond | 85 | 140 | 7249 | 58.45 | 22 | 24 |
| Strauss | 100 | 178 | 7037 | 40.91 | 21 | 27 |
| Hutton | 79 | 138 | 6971 | 56.67 | 19 | 33 |
| Barrington | 82 | 131 | 6806 | 58.67 | 20 | 35 |
| Compton | 78 | 131 | 5807 | 50.06 | 17 | 28 |
| Vaughan | 82 | 147 | 5719 | 41.44 | 18 | 18 |
| Hobbs | 61 | 102 | 5410 | 56.94 | 15 | 28 |
| Sutcliffe | 54 | 84 | 4555 | 60.73 | 16 | 23 |
| May | 66 | 106 | 4537 | 46.77 | 13 | 22 |
| Dexter | 62 | 102 | 4502 | 47.89 | 9 | 27 |
It’s interesting that none of these fine England batsmen ranks in the top ten as far as all-time Test cricket scoring is concerned, Gooch ranking highest at 13th, which is somewhat surprising considering that England has been playing cricket for longer than any nation other than Australia, which has three ranked in the top ten (Ponting, Border and Steve Waugh). With the exception of Graeme Smith, all of the players ranked above Gooch played many more Tests – perhaps England is quicker to jettison top players as they reach the end of their careers, in our continued efforts to make it easier to beat us.
Certainly using standard stats Pietersen fairs pretty well, with a higher average and more tons (and a much better conversion rate) than any of those who have scored more runs – though surely Cook will have the opportunity to surprass KP’s runs total before too long.
Moving now to impact numbers, if we rank based on career impact numbers for batting only, we see the following:-
| Impact% | Player |
| 1199 | Gooch |
| 1194 | Boycott |
| 1114 | Cowdrey |
| 1114 | Gower |
| 1065 | Stewart |
| 1001 | Atherton |
| 991 | Cook |
| 966 | Strauss |
| 944 | Hutton |
| 938 | Hammond |
| 936 | Barrington |
| 860 | Pietersen |
| 723 | Hobbs |
| 673 | Sutcliffe |
| 657 | Vaughan |
| 643 | Compton |
| 599 | Dexter |
| 567 | May |
There is some movement up and down, but by far the biggest difference is that Pietersen has fallen quite dramatically from his total runs ranking, having the lowest career impact total of any of the players with more than 100 Tests under their belt. Though it won’t help Pietersen, a per-innings ranking will be fairer to Hobbs et al:-
| ImpPerInns | Player |
| 8.01 | Sutcliffe |
| 7.15 | Barrington |
| 7.09 | Hobbs |
| 6.84 | Hutton |
| 6.70 | Hammond |
| 6.19 | Boycott |
| 5.93 | Cowdrey |
| 5.87 | Dexter |
| 5.58 | Gooch |
| 5.49 | Strauss |
| 5.46 | Gower |
| 5.42 | Cook |
| 5.35 | May |
| 4.91 | Compton |
| 4.75 | Pietersen |
| 4.72 | Atherton |
| 4.53 | Stewart |
| 4.47 | Vaughan |
I admit that before finishing this analysis I had expected that Hobbs would be at the top of this list, but here we see that in fact his longtime opening partner Herbert Sutcliffe is at the head of the field. Not only that, but good old Kenny Barrington also sneaks ahead of the Master. Pietersen has fallen still further when considering impact per innings, which may be an indication of his getting out when he shouldn’t more often that others.
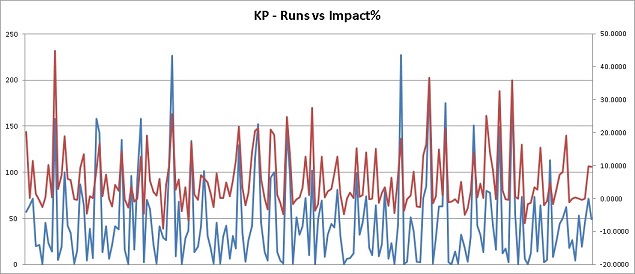
But there’s no doubt that KP has crafted some phenomenal innings so maybe a look at high-impact innings will see him climb the rankings. After all, he has more tons to his name than any England batsmen besides Cook. As I hope I’ve made clear by now though, not all tons are high impact, in fact the correlation between tons and highest-impact is not as high as you would imagine (for this group, it’s around +0.3). A look at the graphic at the top of this page will illustrate the point – Pietersen’s great innings have not always been his biggest scores, and vice versa.
I’ve graded innings as ‘useful’ (more than 10% match impact), ‘good’ (more than 20% match impact)) and ‘great’ (more than 30% match impact). At a later date I’ll list the most impactful innings of all-time, but for now here are our players ranked by the number of great innings they made:-
| 30%+ | Player |
| 10 | Hammond |
| 7 | Atherton |
| 6 | Hutton |
| 5 | Gooch, Stewart, Strauss, Cook |
| 4 | Sutcliffe, Cowdrey, Barrington, Vaughan, Pietersen |
Hammond is significantly ahead of the others, but the surprise for me is the man in second, Atherton. Athers has a signicantly lower average than the other players in this study, but obviously by this measure has stepped up when England most needed him. Pietersen is in the middle of the pack, with one fewer great innings than Cook. Once again ranking on a per-innings basis, the top five are:-
| %Great | Player |
| 7.14% | Hammond |
| 4.76% | Sutcliffe |
| 4.35% | Hutton |
| 3.30% | Atherton |
| 3.05% | Barrington |
| 2.94% | Hobbs, Dexter |
In terms of failures, I define a failure as an innings having an overall negative impact, however small, on the batting team’s win probability, or conversely a positive impact on the opposition’s win probability. A failure isn’t therefore a duck or low score, it could be a score in the thirties when the team needed the batsman to stay in. Here are the players ranked on percentage failures based on total innings:-
| %Fail | Player |
| 17.9% | Sutcliffe |
| 22.1% | Hammond |
| 23.9% | Hutton |
| 24.5% | May |
| 25.2% | Barrington |
| 25.5% | Hobbs |
| 26.0% | Compton |
| 26.2% | Cook |
| 26.7% | Strauss |
| 27.0% | Gower |
| 27.5% | Dexter |
| 28.7% | Pietersen |
| 30.2% | Stewart |
| 30.3% | Cowdrey |
| 32.1% | Gooch |
| 33.2% | Boycott |
| 33.3% | Atherton |
Although KP is towards the bottom of the list, he’s not significantly worse than the others, better for example than Cowdrey and Gooch. Athers is intriguing, second in total number of great innings and yet last in terms of failures, though this could be related to the fact that England had a much worse win-loss record in his day.
It’s interesting that the same three batsmen feature in the top 3 in terms of both percentage of great innings made and lowest percentage of falures :- Hammond, Sutcliffe and Hutton. The top five as regards impact per innings are Sutcliffe, Barrington, Hobbs, Hutton and Hammond – here are how those five rank in the main impact categories:-
| Player | Impact% | Over 10% | Over 20% | Over 30% | Under 0% |
| Sutcliffe | 1 | 3 | 1 | 3 | 1 |
| Barrington | 2 | 2 | 2 | 8 | 7 |
| Hobbs | 3 | 1 | 3 | 9 | 8 |
| Hutton | 4 | 4 | 5 | 4 | 4 |
| Hammond | 5 | 11 | 6 | 1 | 2 |
I would have to say, taking into account all of the impact measures and considering that he ranks in the top three of all of the main categories, that I would rank Sutcliffe as the most impactful England batsman of all-time.
Back to Pietersen, we don’t see him particularly shining impact-wise as compared to the all-time England greats. But he may still be the best of his time. so let’s compare him more closely with Cook, as well as his other main contemporaries in batting, Vaughan, Strauss, Collingwood, Bell, Prior and Trott.
Was KP the most impactful of his time then?
The following table compares KP and his contemporaries in terms of match impact while batting, with all of the relevant parameters shown, sorted chronologically:-
| Player | Mat | Inns? | Career Impact | ImpPerInns | Useful (>10%) | Good (>20%) | Great (>30%) | Failures |
| Vaughan | 82 | 147 | 657% | 4.47% | 18 | 4 | 4 | 49 |
| Collingwood | 68 | 112 | 423% | 3.78% | 11 | 4 | 3 | 34 |
| Strauss | 100 | 176 | 966% | 5.49% | 22 | 14 | 5 | 47 |
| Bell | 98 | 168 | 610% | 3.63% | 12 | 9 | 4 | 59 |
| Pietersen | 104 | 181 | 860% | 4.75% | 26 | 10 | 4 | 52 |
| Cook | 102 | 183 | 991% | 5.42% | 26 | 9 | 5 | 48 |
| Prior | 75 | 116 | 439% | 3.78% | 8 | 7 | 1 | 31 |
| Trott | 49 | 87 | 483% | 5.55% | 11 | 5 | 3 | 20 |
What stands out immediately is the sustained excellence of Andrew Strauss and Alastair Cook. Also Trott, assuming he gets back into the England team, has maintained a very high level.
In terms of great innings, Strauss and Cook lead with five, Vaughan, Pietersen and Bell have four each, Trott and Collingwood three and Prior has just one. However, Prior’s one great innings actually rates the highest of them all in terms of match impact, his match-saving 110 in Auckland measuring at 57.63%.
In terms of career progression, Pietersen exploded out of the blocks, his very first Test innings being worth more than 20% in match impact, and by his 10th innings, that 158 in the monentous draw at the Oval in the 2005 Ashes, he exceeded not just 30% but 40%. Cook meanwhile did not exceed 30% until his 109th Test innings, his 110 in the third innings against Pakistan at the Oval in 2010, though England would lose. Once that particular pinnacle had been assailed however, he absolutely took off during that winter’s Ashes with two innings worth more than 40% in match impact, the first his 235* which turned the match at Brisbane, the second his 189 at Sydney which crowned a fantastic series for him. Bell was also slow to get going, his first great innings coming in his 96th innings, the highest coming against India, 159 at Trent Bridge in 2011. Unlike Cook, who had no fewer than seven innings with over 20% of match impact prior to his first great innings, Bell had just three. He seemed to get the clue in 2010, though – all of his great innings came since then.
Vaughan was noted for ‘daddy’ hundreds, though his most impactful came with a relatively ‘baby’ ton against New Zealand, 106 at Lord’s in 2008. Collingwood has three great innings but in a lot fewer total innings than the rest (other than Trott); his most impactful was his 135 in the third innings against South Africa at Edgbaston in 2008. Trott has three great innings to his name in Tests, the highest-rated coming against Sri Lanka, his 203 at Cardiff in 2011.
Pietersen, after his eye-opening start, did not produce an innings worth more than 30% in match impact until his 126th in Tests, the 202* vs India at Lord’s in what was the 2000th Test match to have been played. In that time, the other players covered by this study had accounted for 13 great innings – three each by Collingwood, Strauss and Cook, two for Trott and one each by Vaughan and Bell. KP then accounted for three of the next seven.
Now, as we did for the all-time greats let’s see how the eight contemporaries rate in the main impact categories, ranked in order of impact per innings:-
| Player | Impact% | Over 10% | Over 20% | Over 30% | Under 0% |
| Trott | 1 | 3= | 2 | 1 | 1 |
| Strauss | 2 | 1 | 1 | 2 | 3= |
| Cook | 3 | 3= | 3= | 3= | 2 |
| Pietersen | 4 | 2 | 3= | 7 | 5 |
| Vaughan | 5 | 5 | 8 | 3= | 7 |
| Prior | 6= | 8 | 6 | 8 | 3= |
| Collingwood | 6= | 6 | 7 | 3= | 6 |
| Bell | 8 | 7 | 3= | 6 | 8 |
Based on the above I would have to say that, considering his relative longevity, Strauss has been the most impactful of KP’s contemporaries, but KP is by no means disgraced here – he ranks second only to Strauss in terms of most useful innings, suggesting he isn’t as mercurial as some would have it, and he is around the middle of the pack in terms of failures.
It’s interesting to note that the 2005 Oval performance has remained Pietersen’s most impactful performance and is his only innings to top 40%, while Cook has exceeded that mark on four occasions and is well ahead of the others in the study. Vaughan is the only other player with more than one innings over 40%, the first coming with 197 against India at Nottingham in 2002, the second the previously mentioned knock against New Zealand. Also of interest is the fact that KP, who had not exceeded 30% in 115 Test innings since that 2005 performance, had three great innings after Cook’s ascension to true greatness in the 2010-11 Ashes series. How much did Cook’s improvement affect Pietersen? It could be that Pietersen’s desire to be the best coupled with Cook’s rise to greatness spurred Pietersen on to yet higher peaks.
Whatever the case, it’s worth noting that since his epic in that 2000th Test Pietersen has averaged more impact per innings than the other five who have played since that time (5.18%, as against 5.05% for Cook, 4.59% for Trott, 4.11% for Bell and 3.74% for Prior).
Finally, consider this – Cook has played 32 innings since his last great innings and Trott has played 41, whereas KP has been thrown on the scrapheap only 25 innings after his last epic.


Amazing piece of research Dave
Athers – wag :wub:
Comment by fredfertang | 12:00am GMT 6 March 2014
Second that, very clear how much effort went into this.
Comment by James | 12:00am GMT 7 March 2014
Cheers lads – hoping for kudos from the great man himself.
Comment by Dave Wilson | 12:00am GMT 7 March 2014
I suppose with Gooch the fact that he took the South African filthy lucre and missed three years of test cricket would explain why he’s not further up on the run chart. Because he certainly wasn’t jettisoned too soon (I think England probably should have kept him out when he didn’t tour the West Indies in 1993/94).
Comment by Joseph | 12:00am GMT 10 March 2014